



Discover how regional differences impact automotive ratings and why a 4.6 score means different things in different states. Adjust your perceptions accordingly.
Welcome to the REV. A weekly briefing on what the Auto industry can learn about customer experience from millions of Google reviews. Every Thursday, we Rank, Explore & Visualize automotive reputation & sentiment data.
Our latest research report dropped last week. It analyzes 1.2M Google Reviews from 18,000 U.S. dealerships across Q1, revealing what customers are saying across the auto industry. Check it out below:
Report: Q1 2026 Voice of the Customer Report
Read online. Subscribe to REV
A 4.6 in Iowa and a 4.6 in California don't tell you the same thing. Same number, same month. In one market it clears the bar, in the other it's behind it. And if your OEM, your corporate office, or your next owner is grading you on the raw number, one of those verdicts is wrong.
Reputation has a regional baseline, wide enough to flip the same rating from strong to mediocre. So the question, whether you're being scored or are the one doing the scoring, is whether anyone's adjusting for it.
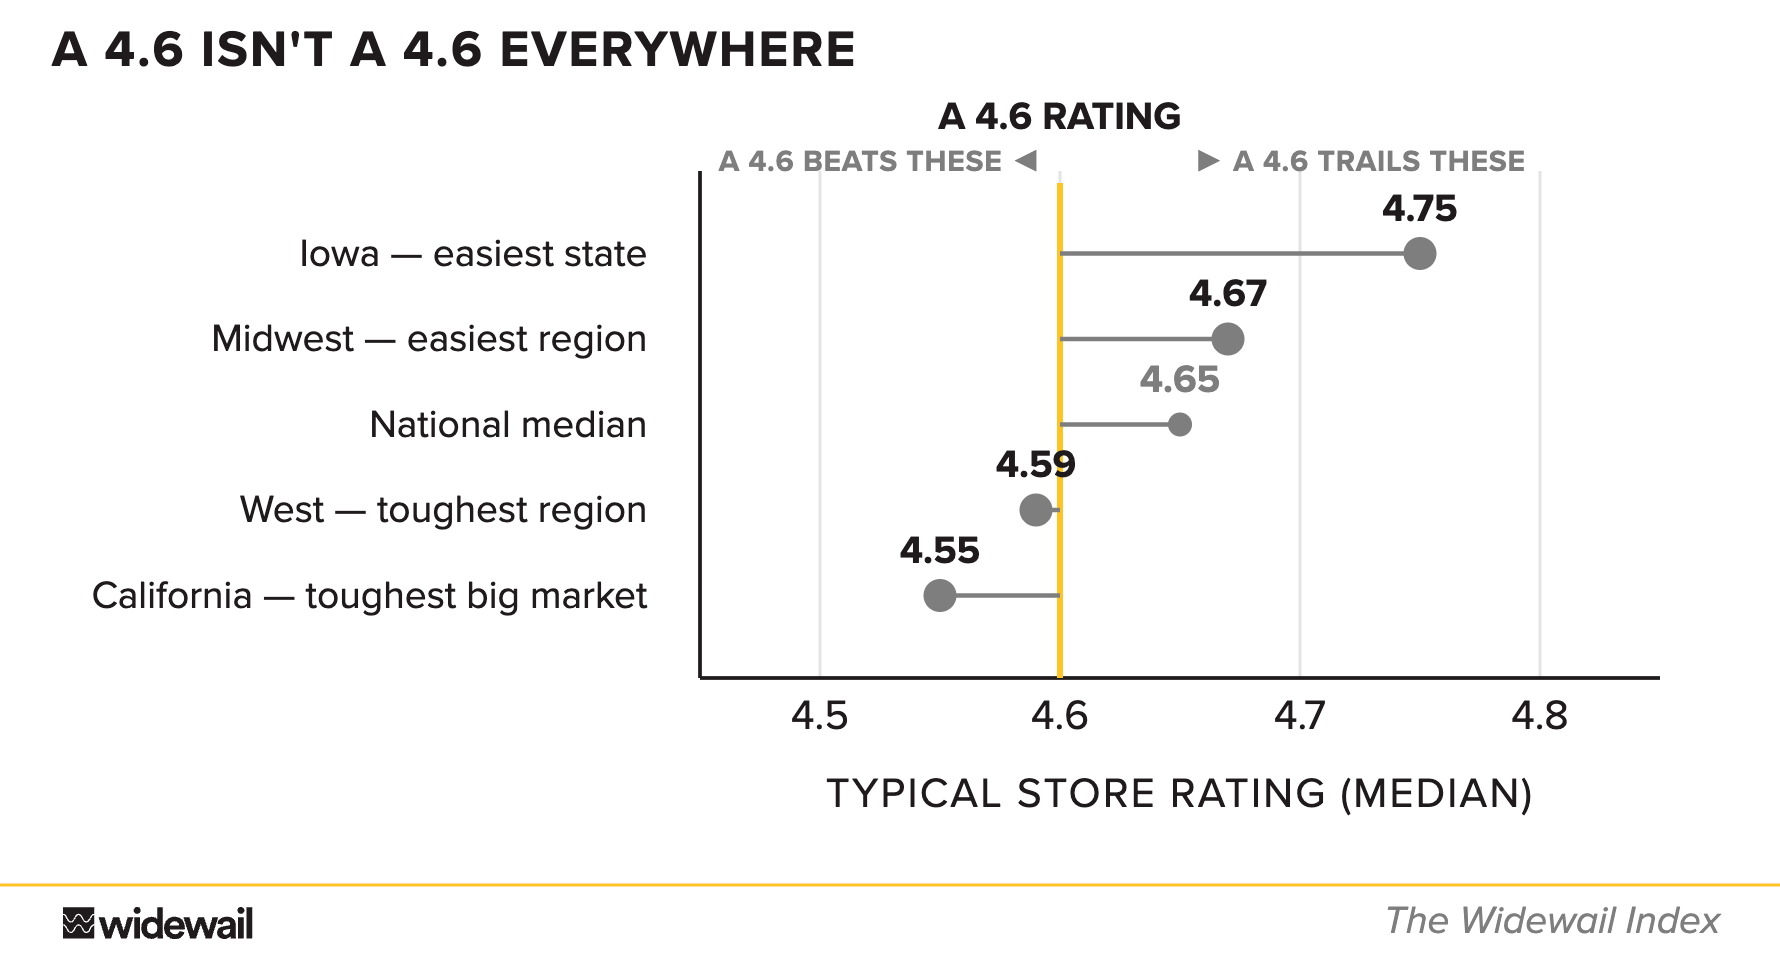
The typical California store sits at 4.55, the lowest of any state with real scale in it. The typical Iowa store sits at 4.75.
Put that in reviews instead of decimals: a store at 4.6 with 1,000 reviews would need roughly 570 straight five-star reviews, no misses, to reach Iowa's median. The identical store in California is already above the line without writing a single one.
The intuitive read is that the coasts carry more luxury and import stores, and luxury buyers grade harder. That’s half true — but luxury stores rate higher, not lower (4.70 vs 4.65 mainstream), and imports beat domestics 4.68 to 4.63. The coasts carry a mix that should rate better.
Compare like to like and the gap only sharpens. Of the 19 brands with 40-plus rooftops in both regions, the West store trails its Midwest counterpart in 17 — Volvo by a quarter star. Same badge, same training, different zip code, lower number. It isn't effort either: West stores respond slightly more often, not less.
The same rating gets read at every level — GM, group office, regional OEM, national OEM — each against a different cohort, none asking what "good" looks like where the store actually sells cars. That's not a knock on any scorecard; it's a calibration gap.
A national yardstick misprices a local market both ways: it lets an easy market coast and penalizes a hard one. A baseline that adjusts for local dynamics is how you tell a coaching problem from a zip-code problem, and where training actually moves the number.
And the map is finer than any region. Within California alone, county medians run from about 4.3 to 4.7, a wider swing than California to Iowa. Your shopper never sees a region. They see you and the five stores they'd actually drive to.
So the baseline is local. Before you defend your number, or accept someone else's read of it, go find out what a 4.6 is worth on your street. Then bring the gap, not the rating.
See where your rooftop stands against others in your state: pull your Widewail Reputation Scorecard. Full details in the Q1 2026 VOC Report.
See you next week - Emily, Marketing @Widewail


U3GM Blog Post Comments