

Automate reviews, surveys, listings, and video testimonials with technology tailored to automotive. Modernize with Customer Intelligence: track and normalize customer experience and staff performance across the network. Compare against other brands in each micro-market or region with the Widewail Index, a database of 20M+ automotive retail reviews.







Seven capabilities, one platform, running the same way at every store in the network.
Ask every customer, every time.
Requests go out automatically once a deal or a repair order closes, and each one greets the customer by name.
TCR-compliant SMS on a registered A2P 10DLC number, routed to the right rooftop's profile and never the wrong one.
Every request names the employee who helped, which is what makes staff-level scoring possible later.
Learn what customers won't post in public.
Surveys and review requests run from the same place, so nobody gets texted twice in a week.
A bias-free automotive question library: yes/no, 1-5, free text, and NPS, each answer mapped to a topic.
Private answers sit alongside the public ones instead of in a separate report.
Be findable, and be right.
60+ data fields pushed automatically to the places buyers and AI assistants look you up.
Holiday hours applied across the whole group at once, not rooftop by rooftop.
The listings you built stay corrected. No reversion, no games.
Answered fast, in your voice, on every channel.
Every review from every platform in one place, alongside the comments on your paid social.
Self-service at Core, specialists writing from Pro. Either way it reads like a person at your store.
Hostile comments come off your paid ads before they cost you clicks.
Put real customers in your marketing.
Invitations go out after the sale or the service visit. Guided the whole way, nothing to download.
A signed release on every video, good for website, social, and paid.
A full library for about what a single production day costs.
Coach with the customer's own words.
Every review that names one of your people, tied back to that person and delivered in the Staff Performance email.
Every score clicks through to the reviews behind it, so there is nothing left to debate.
The five-star mention that used to die in a manager's inbox reaches the person who earned it.
Watch the market you actually compete in.
Which stores competing for your customers gained ground since last month, and on what.
Local and size-comparable, and your competitors are in it whether they buy anything from us or not.
Read a market you are considering the same way you read your own.
What changes when every dealer in the network gets a monthly diagnosis.
See how each dealer performs against nearby dealerships in the same segment, drawn from the industry's cross-dealer benchmark. That's a real reference point, not a brand-internal floor. No one else can show you this.
When wait-time or communication sentiment turns in a region you'll see the change early. You'll know where to send support to correct course.
Each rooftop gets its own monthly diagnosis, built from everything customers say, including the used and off-brand service your surveys never ask about. Your team arrives with what customers said about that store, not a percentile and a coaching template.
Each one answers a question a program manager already has, without exporting anything.
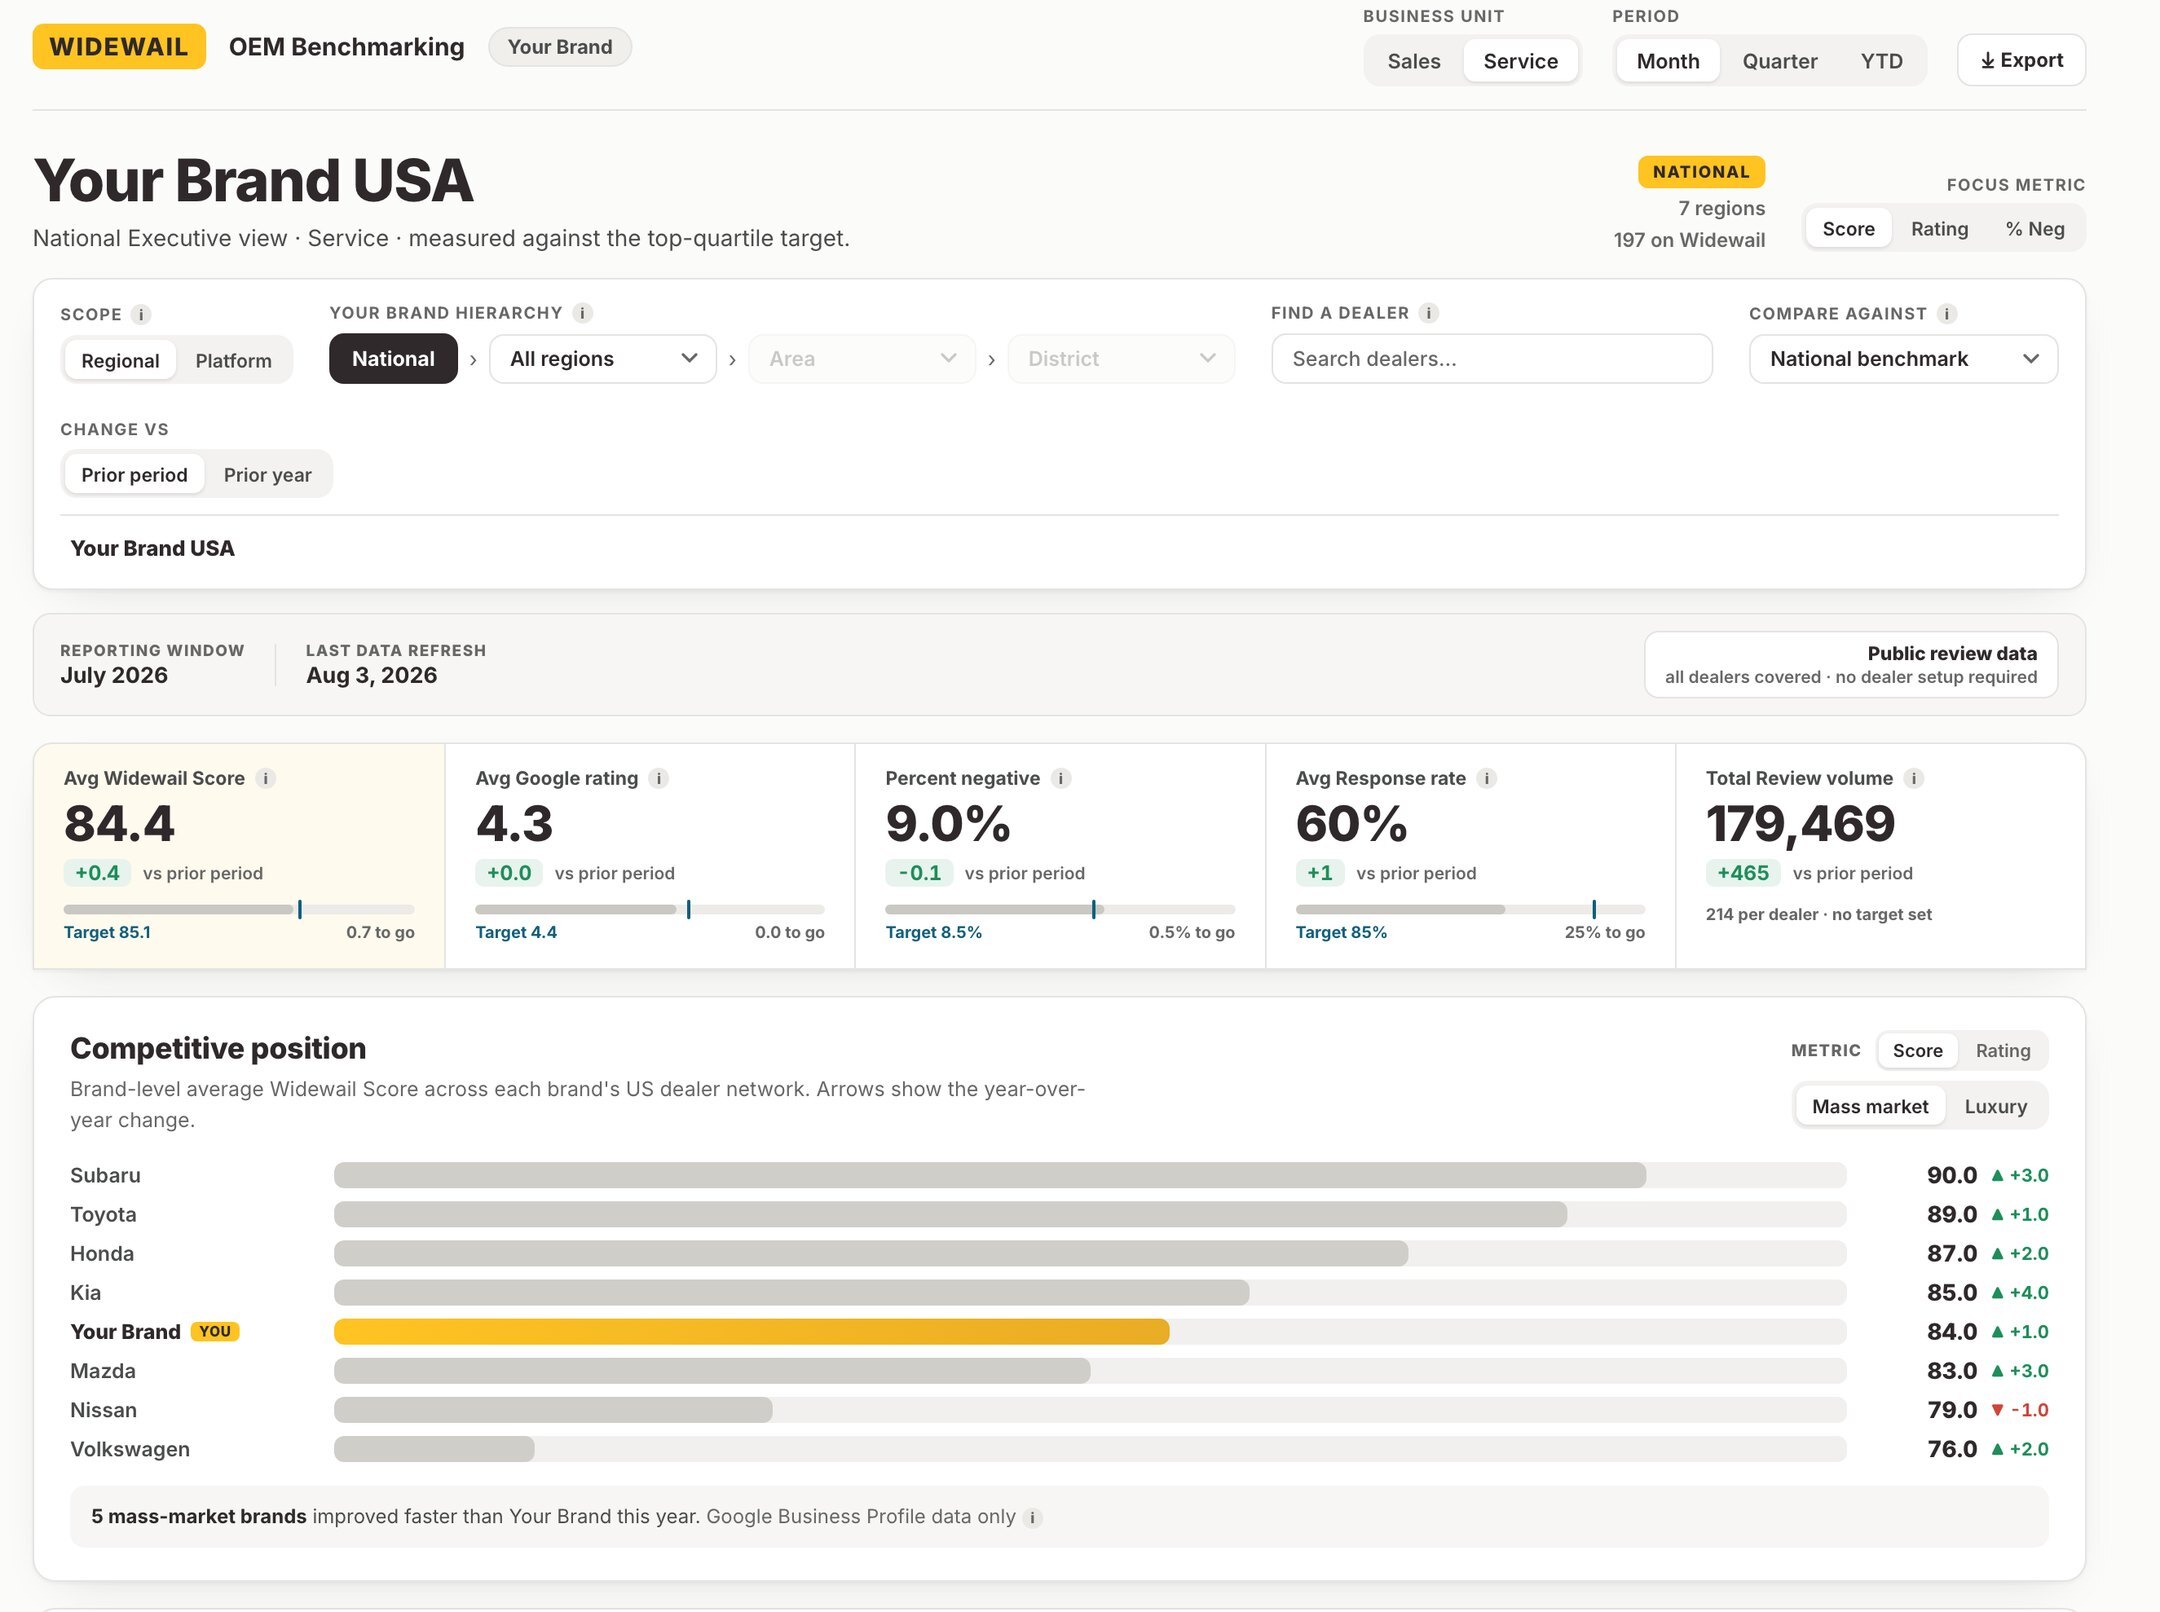
Score, rating, negative share, response rate and volume for the whole network, each against its top-quartile target, beside where your brand sits against every other brand.
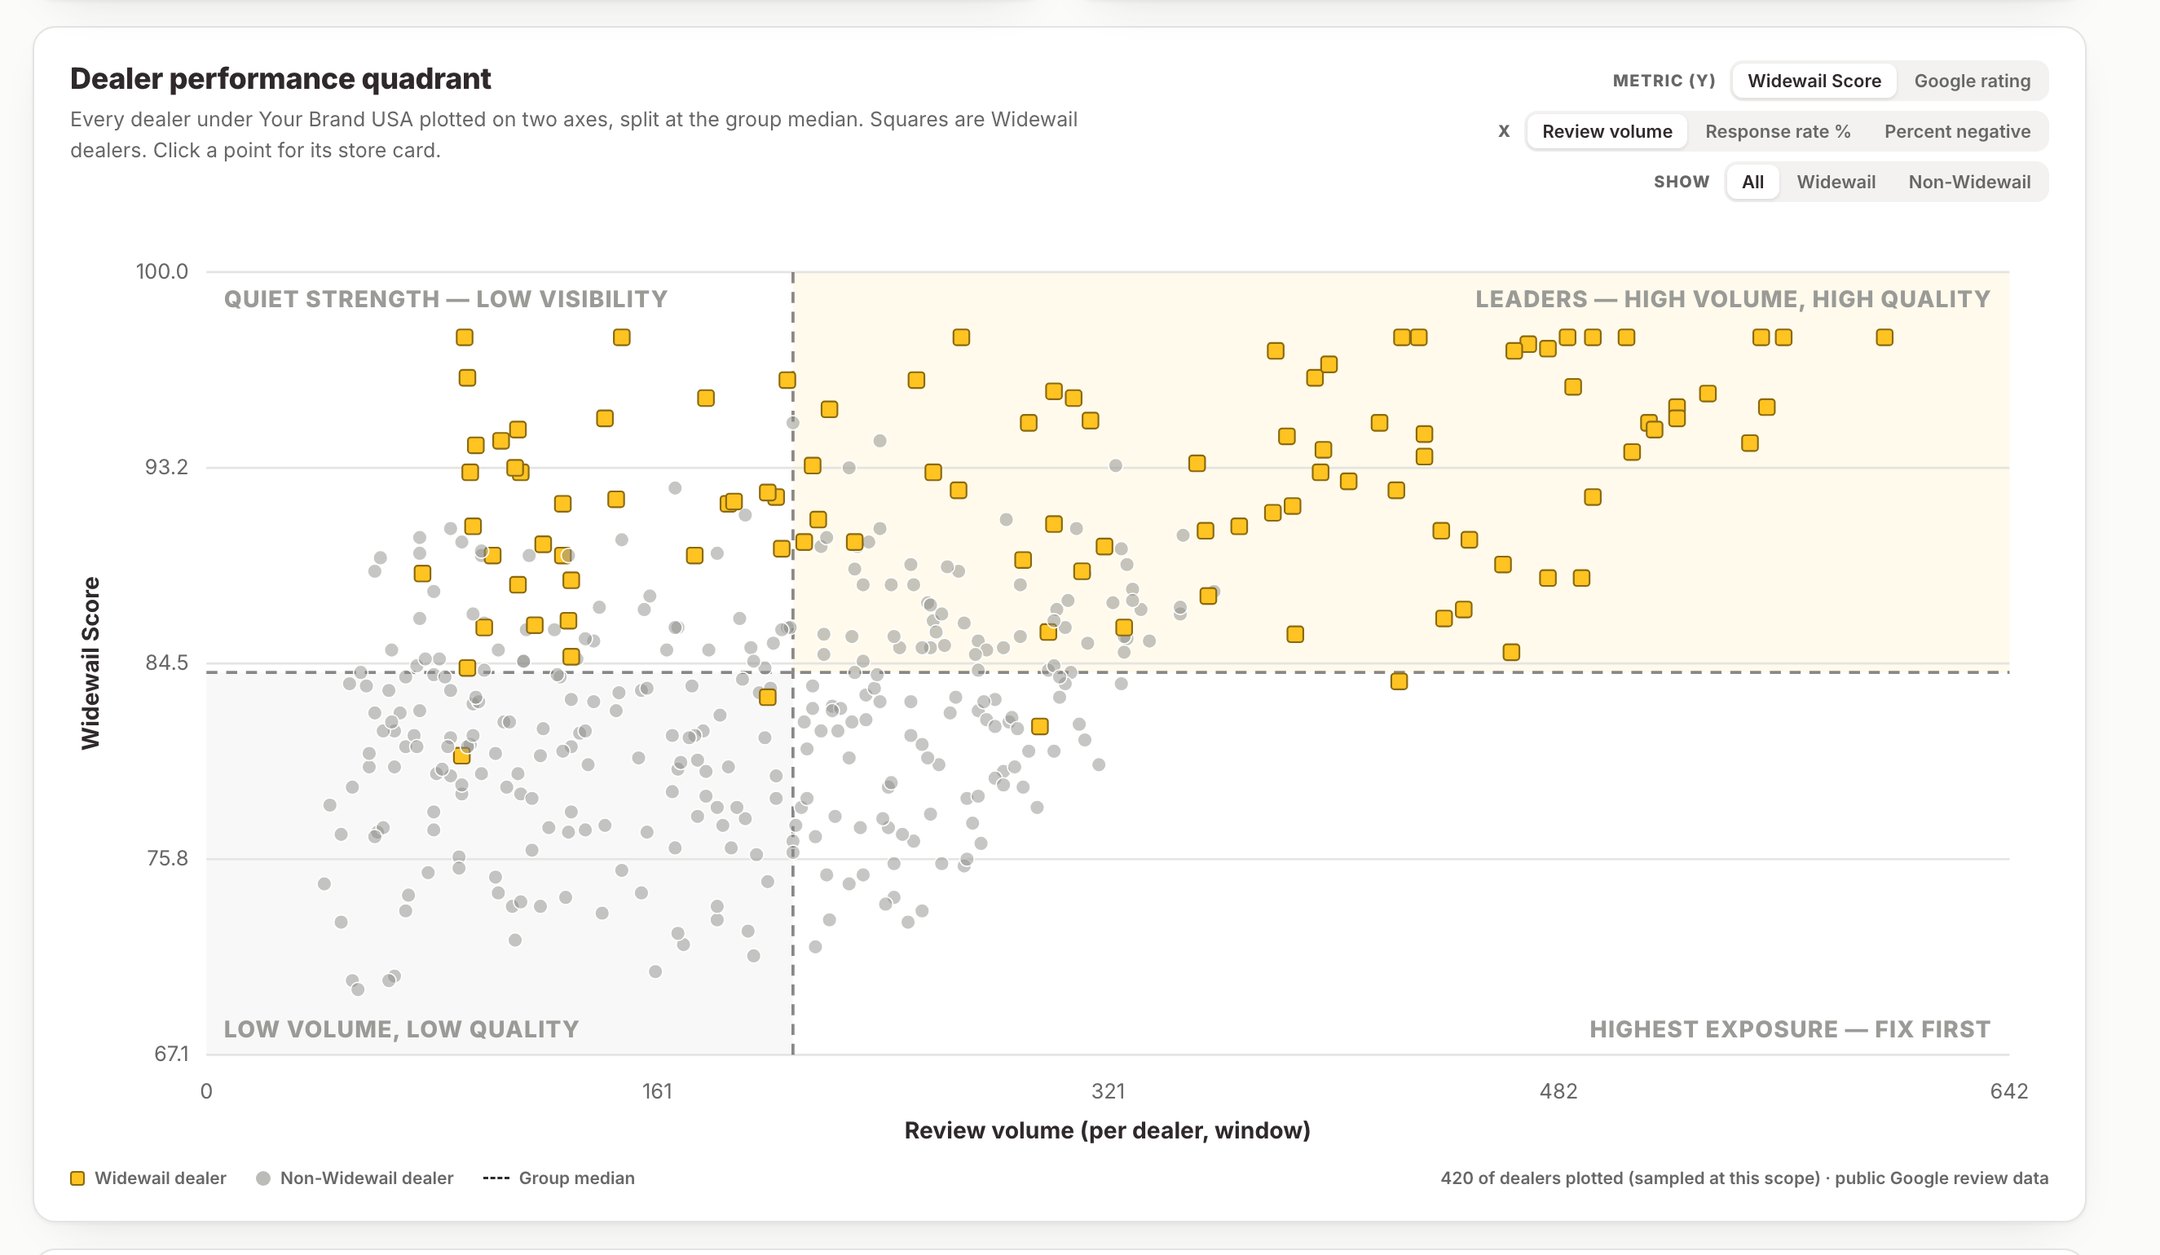
Volume against quality, split at the network median. The lower right is high exposure and low quality, which is where to start.
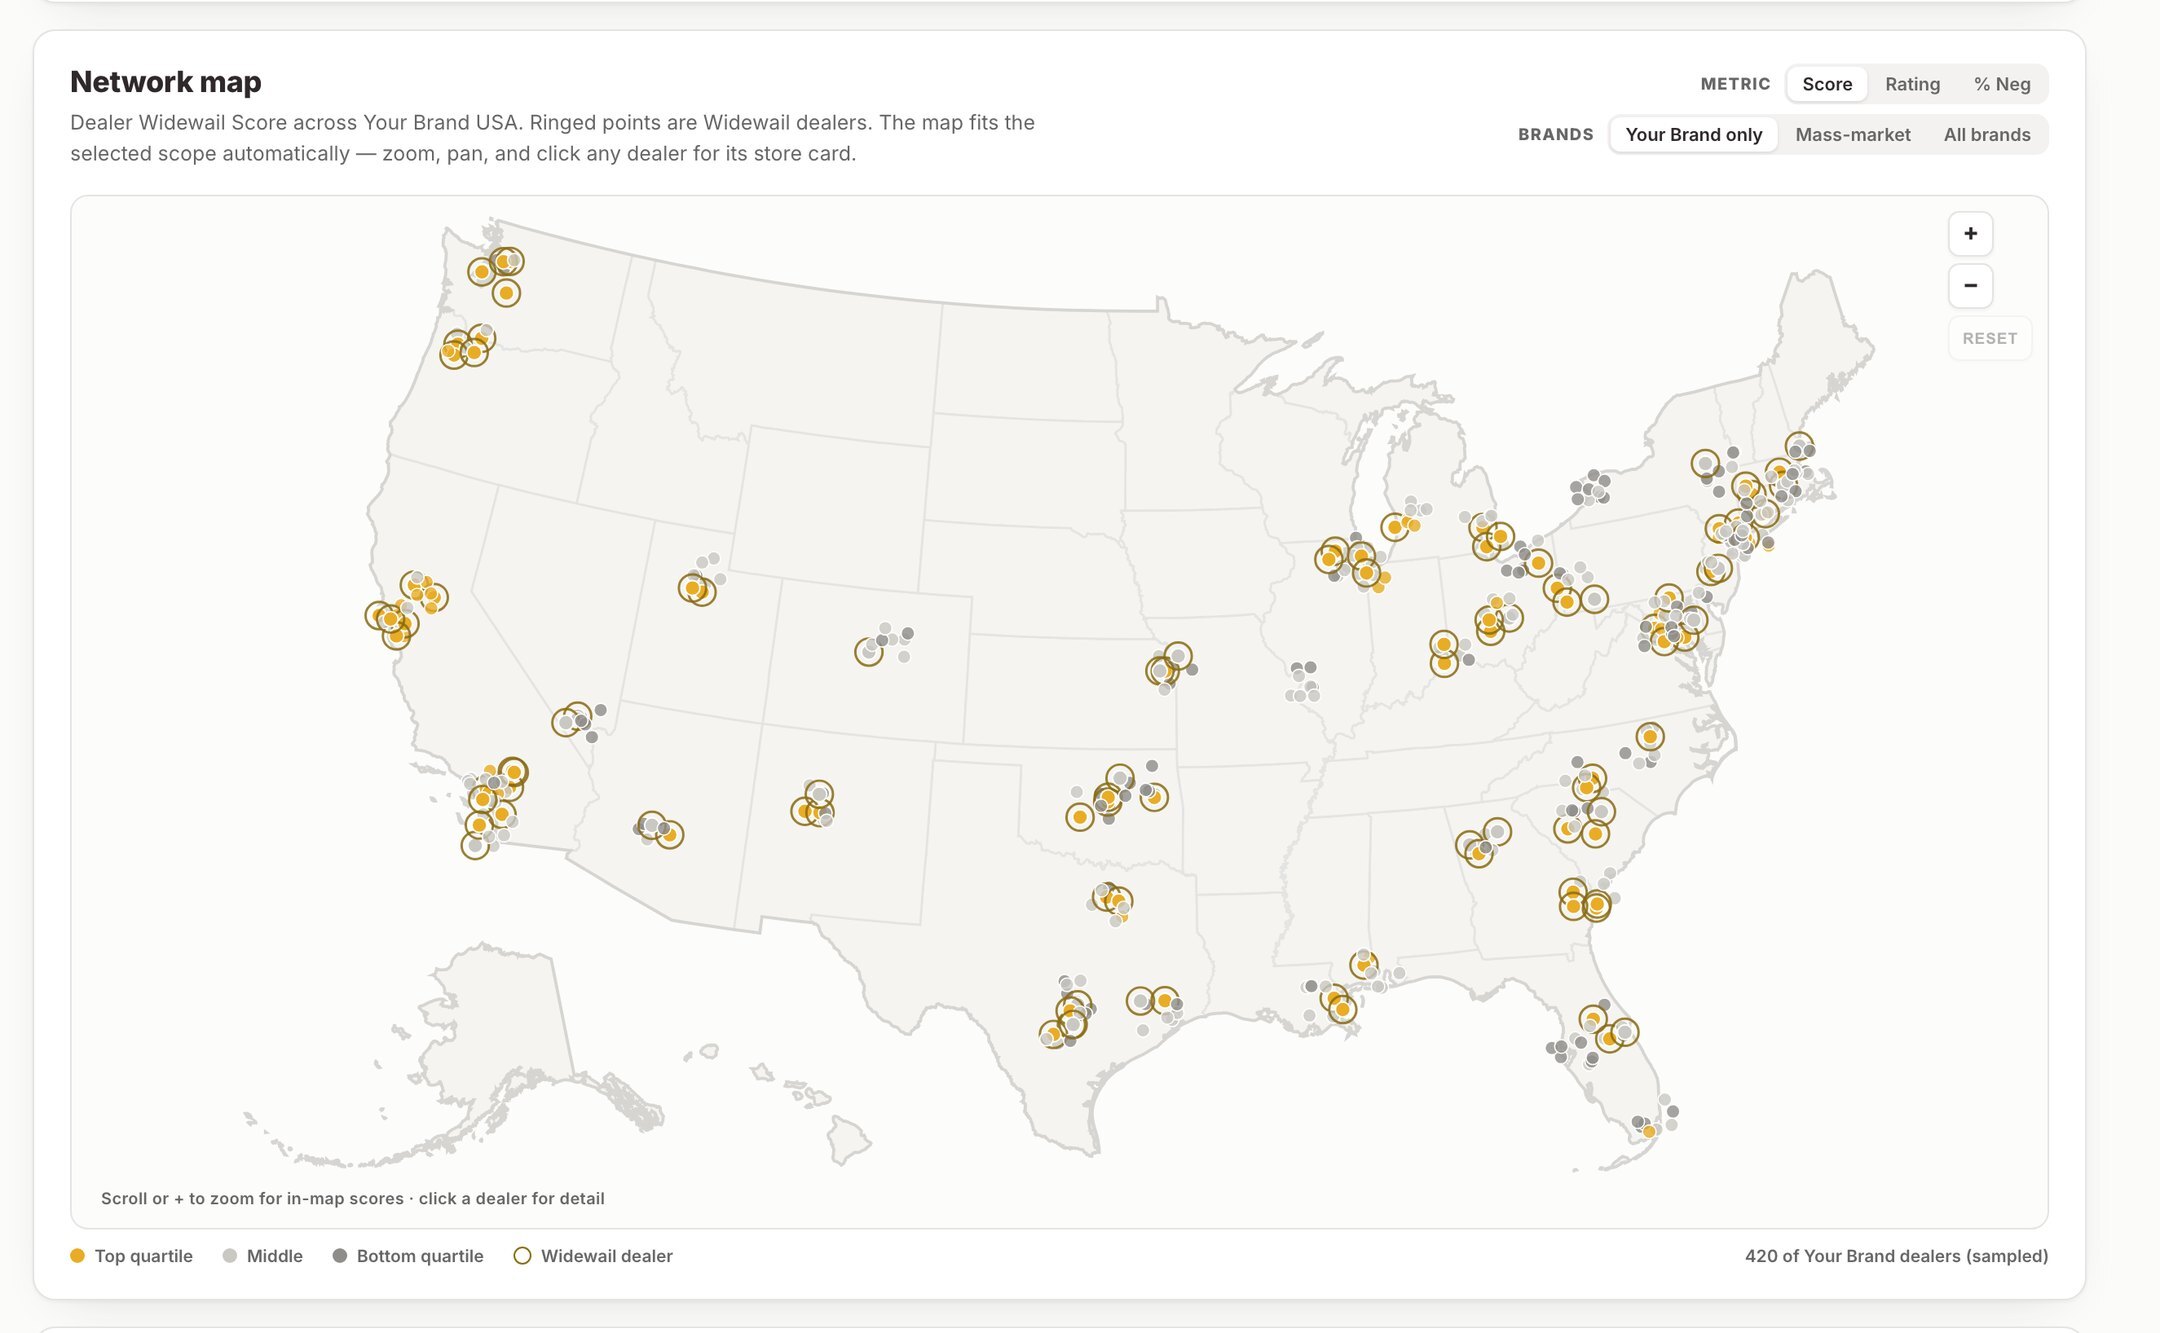
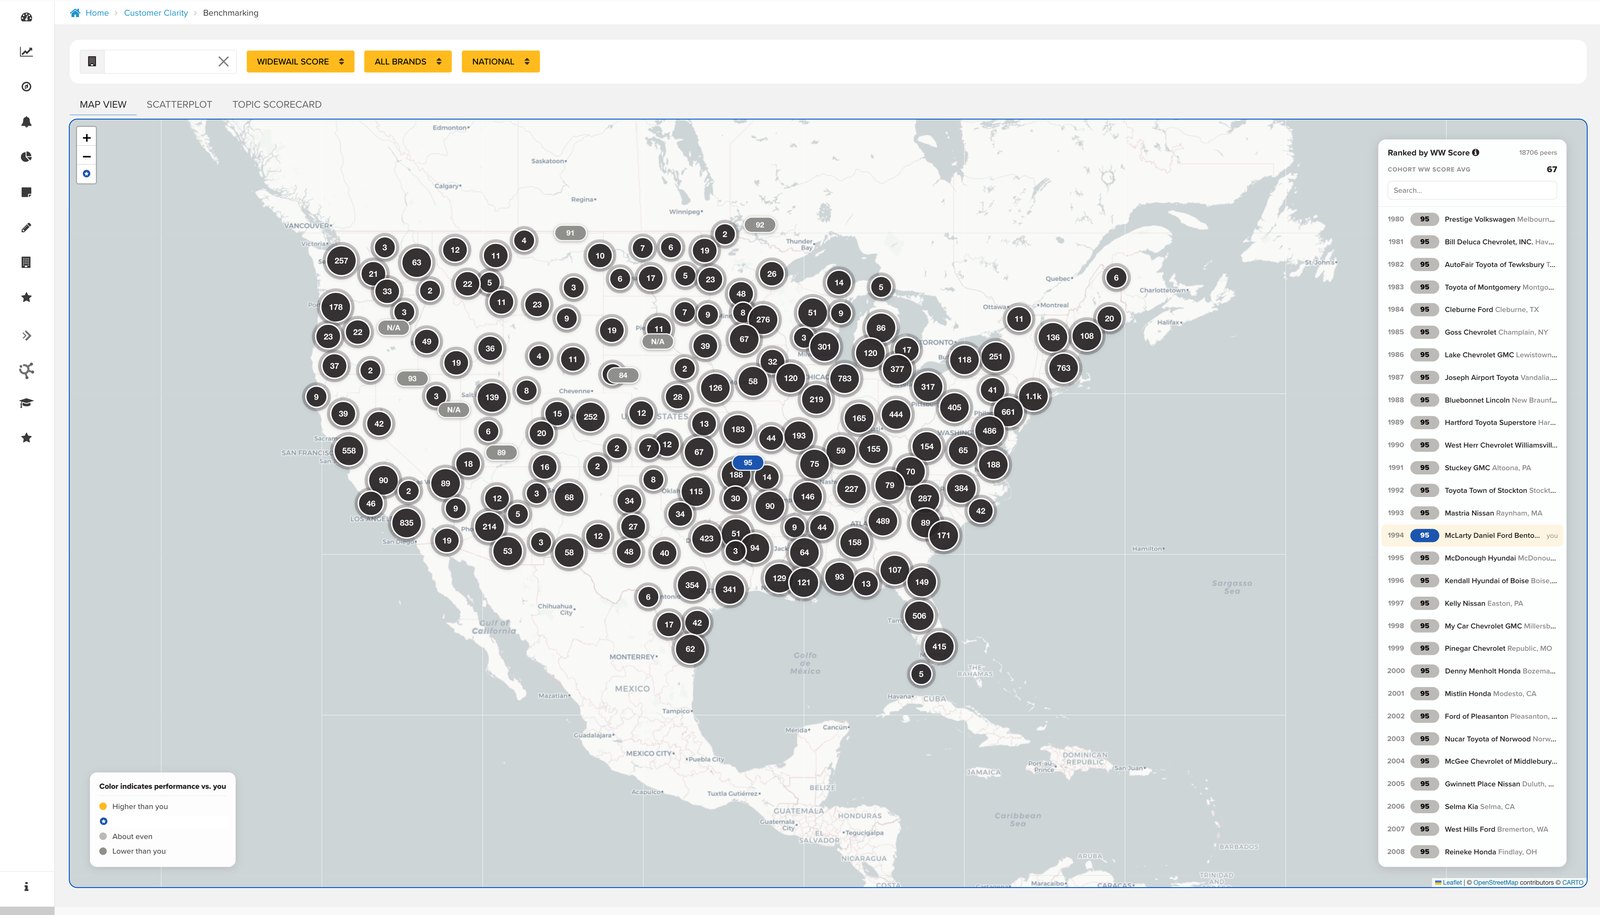
The whole footprint by quartile, so a soft region reads as a shape on a map rather than a row in a spreadsheet.
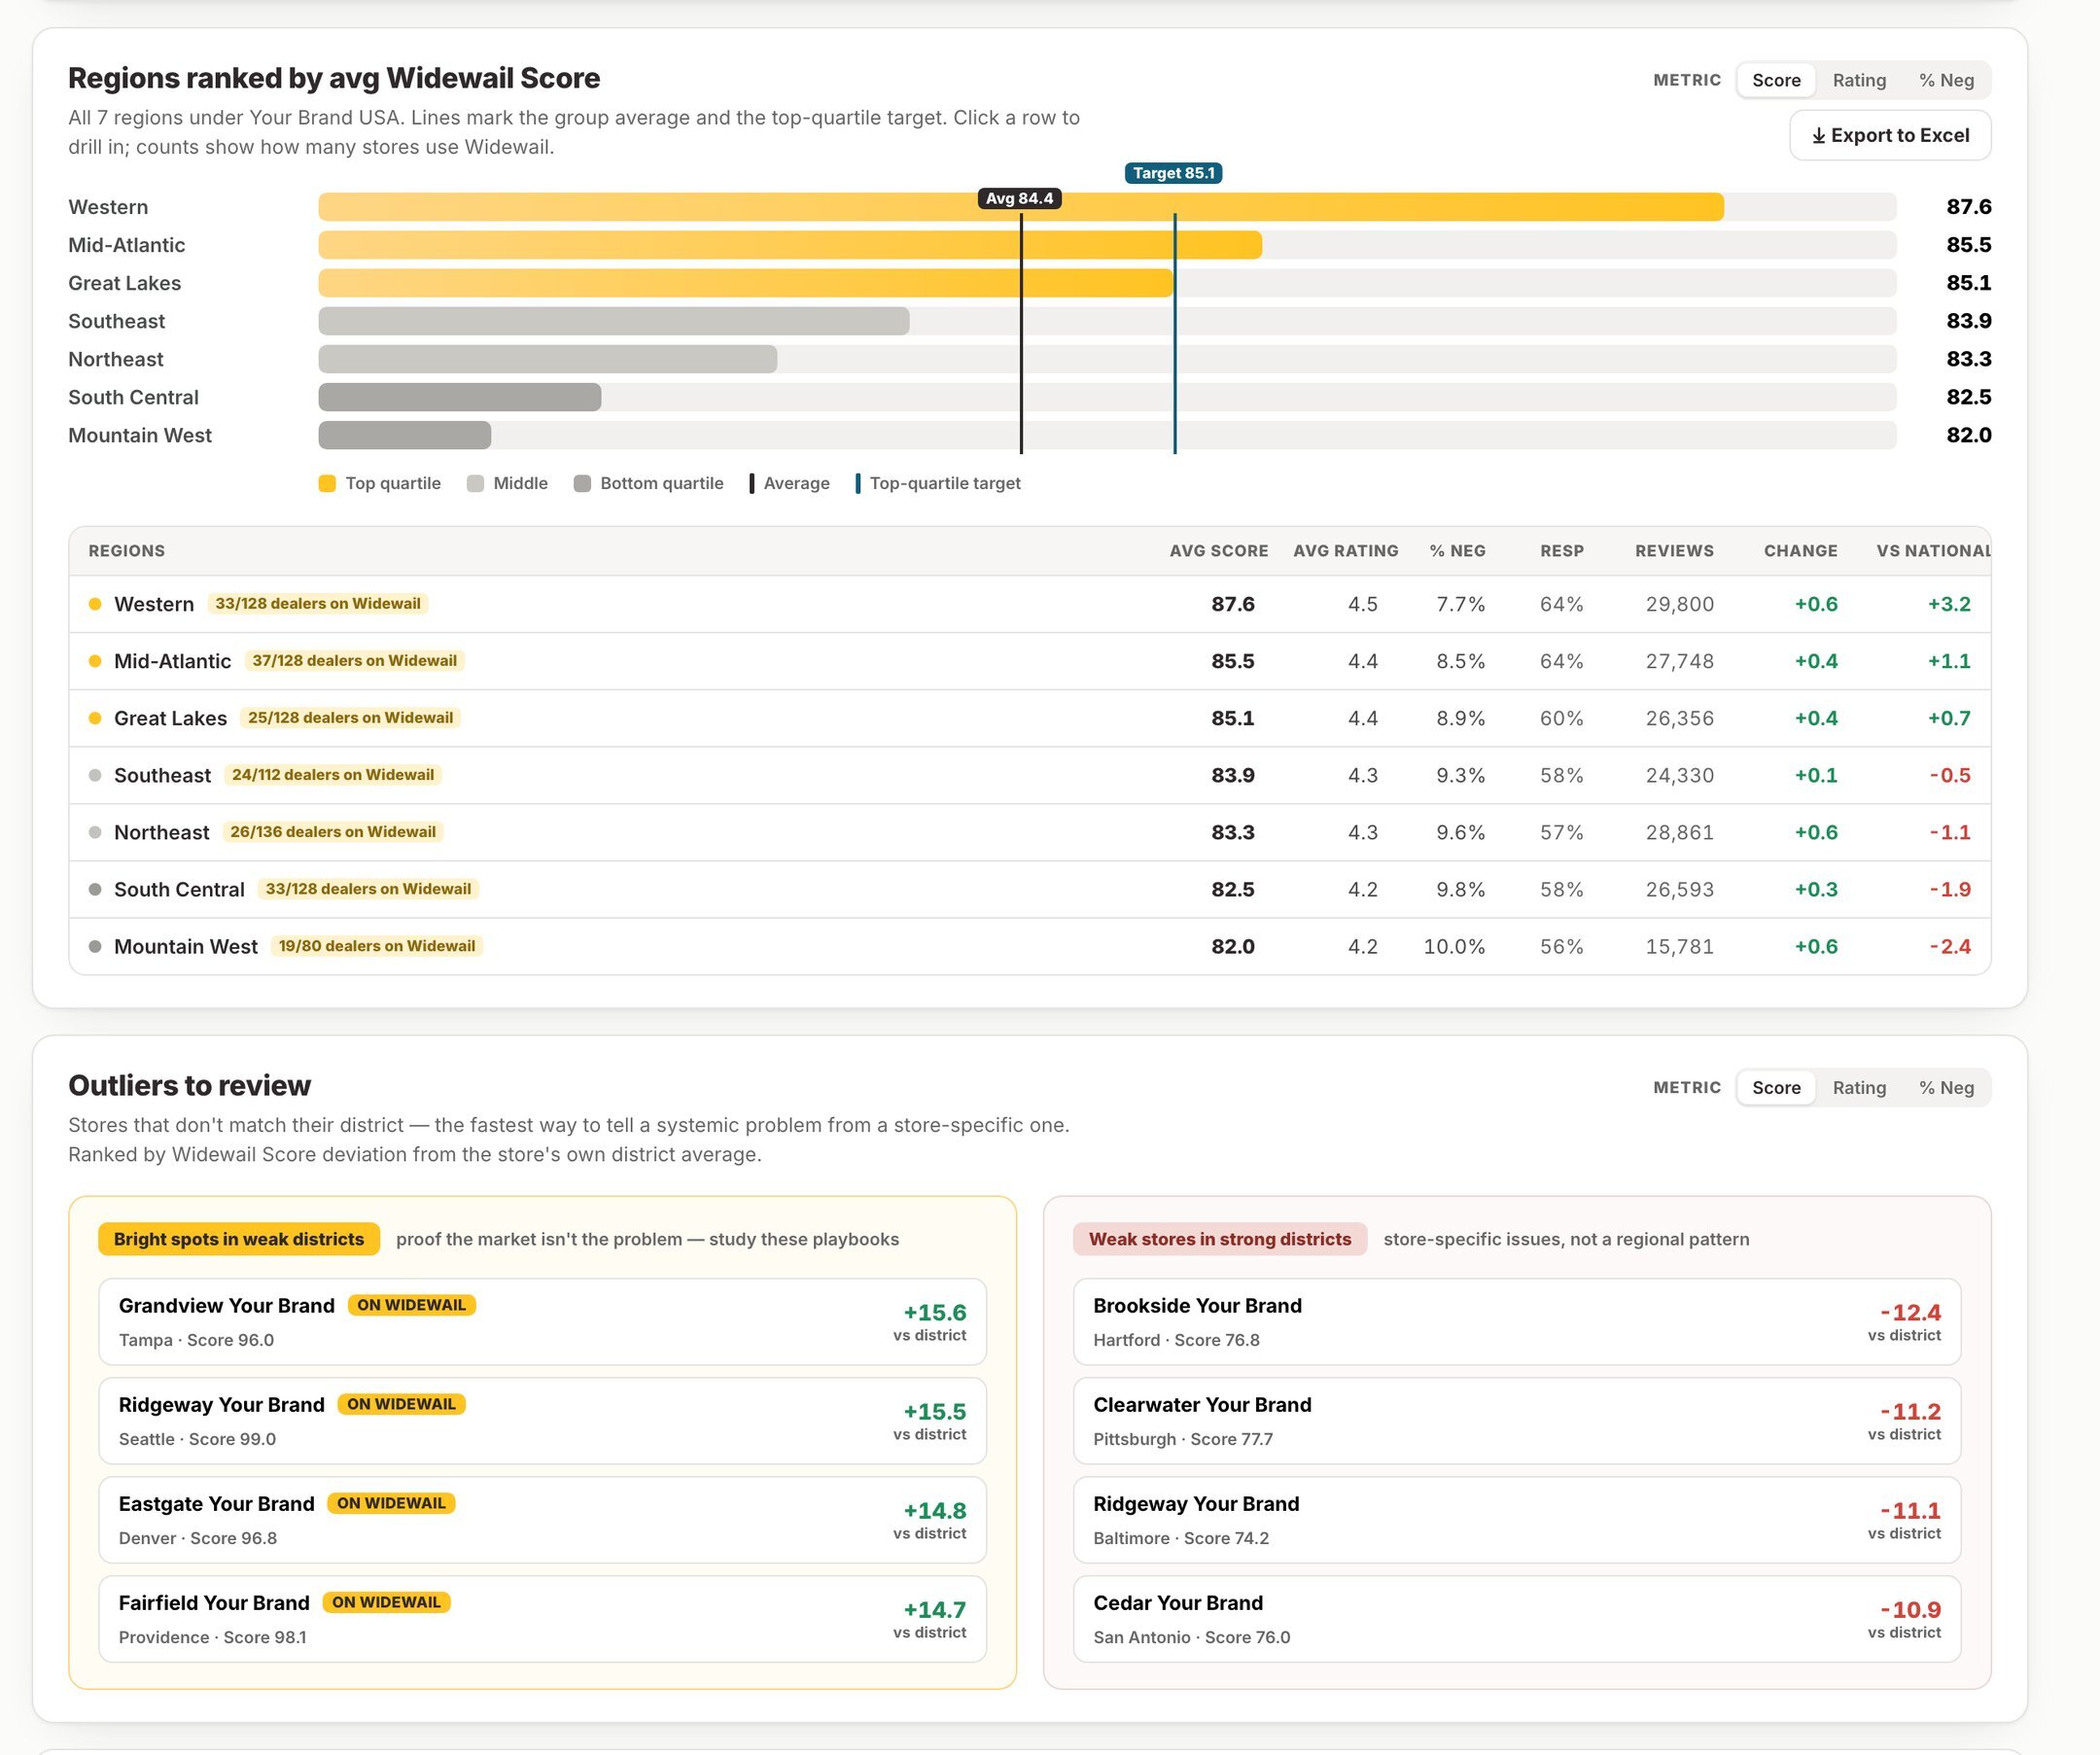
Every region against the network average and the top-quartile target, then the stores that do not match their own district, ranked by deviation. That is how you tell a regional pattern from one store having a bad quarter.
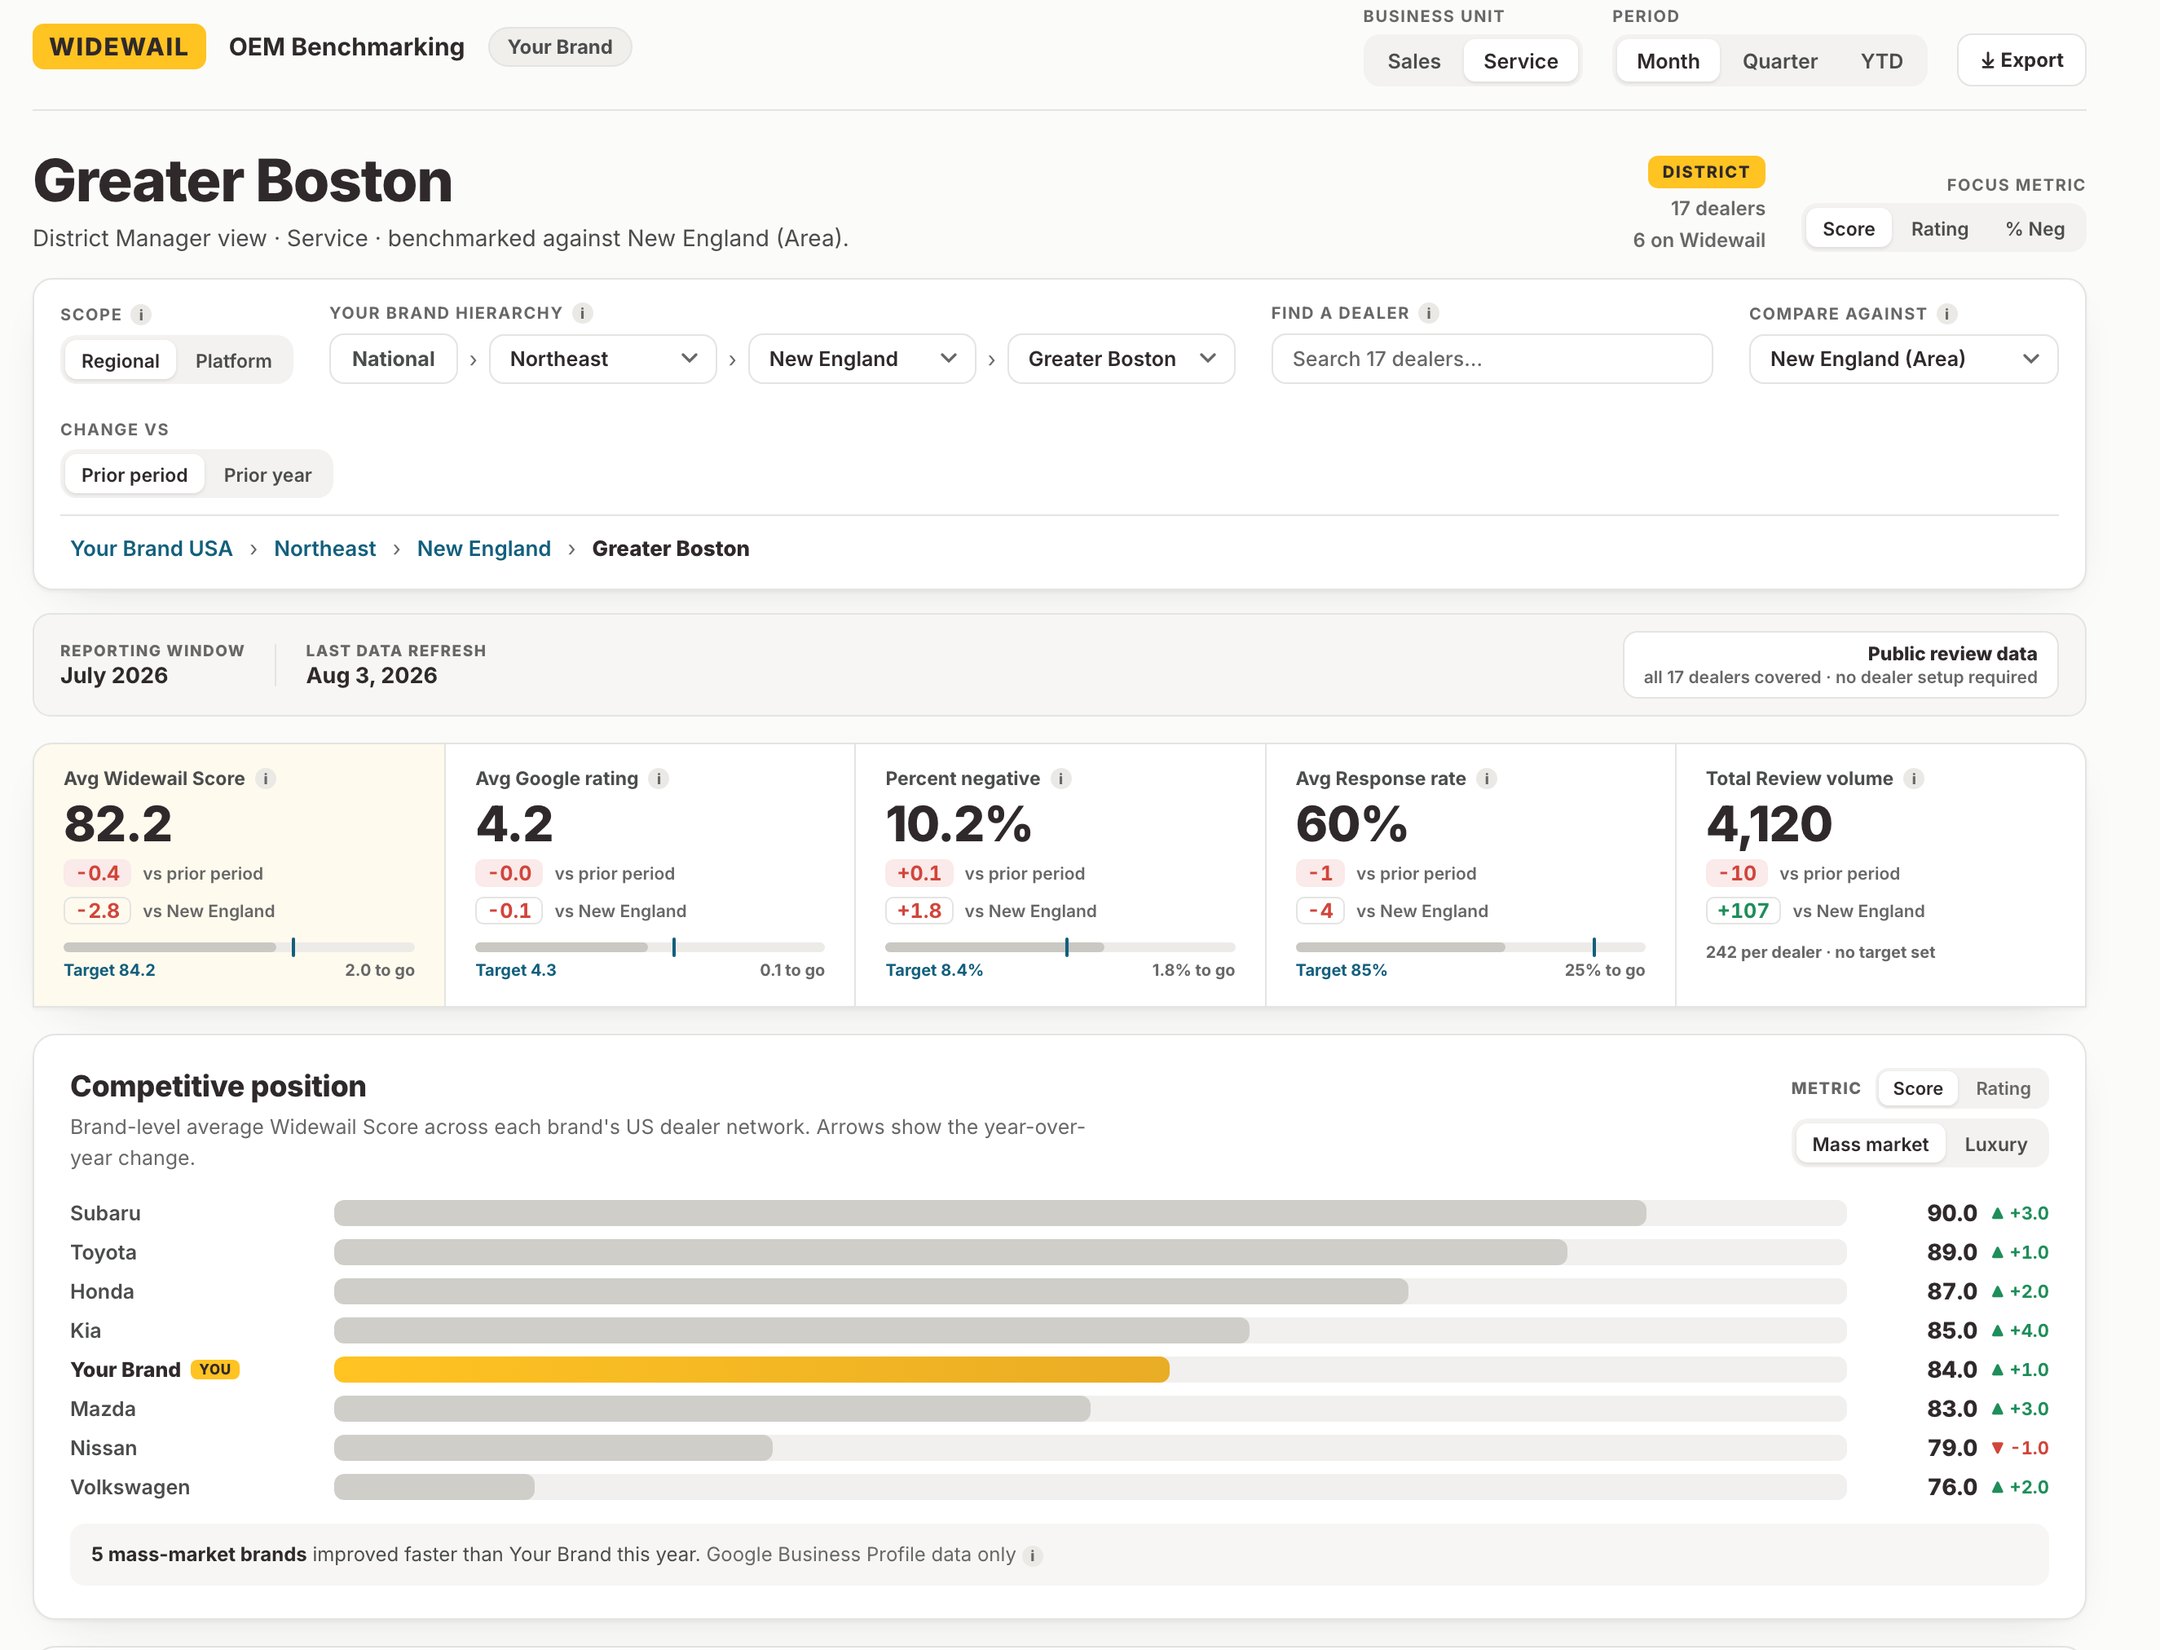
The same read scoped to one district and benchmarked against its area, so a regional manager sees their own numbers instead of the national average.
Four steps, so a movement in the data becomes something a district manager can actually raise with a store.
Which experience driver moved. Measured across 25 topics, so you see the driver underneath the score rather than just the score.
Where it moved. Roll up by geography and drill down: which regions, areas and districts moved, on which topics.
Which rooftops are behind it. The specific stores behind a regional number, and whether each one is declining or simply had one bad period. Month over month, per store.
What to raise with them. The topic, the verbatims behind it, and how that store compares to its own local market. Evidence, not a ranking.
The network view is only as good as what feeds it. Your dealers run the collection and response layer; the program sees the result.
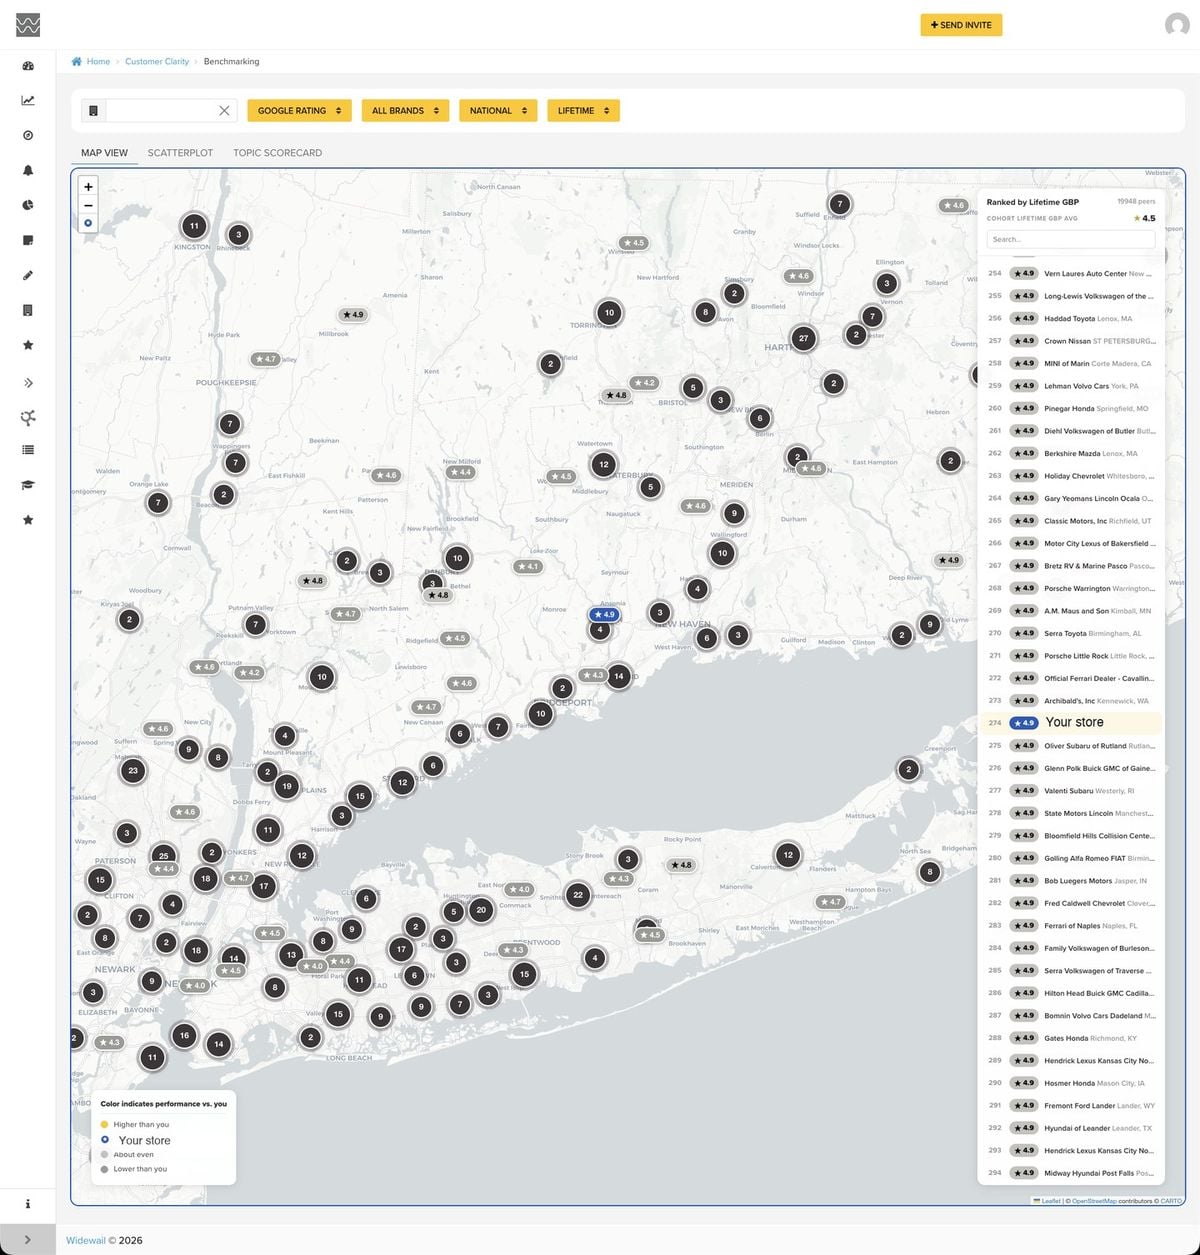
Every dealer sees the same kind of map you do, scoped to their own market: the stores actually competing for their customers, ranked, with the topics behind the gap. A regional problem becomes a specific conversation at a specific store.
Review requests and surveys fire off the events your dealers already log, and every review gets answered. That is what produces the volume the network view reads.
Shoppers ask an assistant for a recommendation now, and the answer is assembled from what customers wrote and how recently they wrote it. Thin, stale review content is what leaves a dealer out of the answer.
Every highlight and every warning in this answer was assembled from customer reviews. Nobody at these stores wrote a word of it.
Answer-engine behaviour changes without notice and no vendor controls it. What we control is the volume, freshness, specificity and routing of the content those answers are built from.
Book a call and we'll walk through the platform in detail for your use case.