


Share of voice, lifetime and by pace
What percentage of all reviews in your radius belong to you, and what percentage of the reviews published this month. When pace runs ahead of lifetime, you are taking share.

Every franchise rooftop around you is earning Google reviews. Some are earning far more than you are, and the gap compounds every month. We will pull the public review data for every dealership inside your 25-mile radius and show you exactly where you sit: against your own brand, and against every franchise in the market.







Tell us which rooftop to run and we will send the analysis for your 25-mile radius.
Your report is built within 24 hours. A member of the Widewail team will reach out with it.
Built from public Google review data for the dealerships in your market.
Share of voice is simply your share of the customer reviews published in your market. The report measures it two ways — across all time, and across reviews earned this month — because the gap between those two numbers is what tells you which direction you are moving.
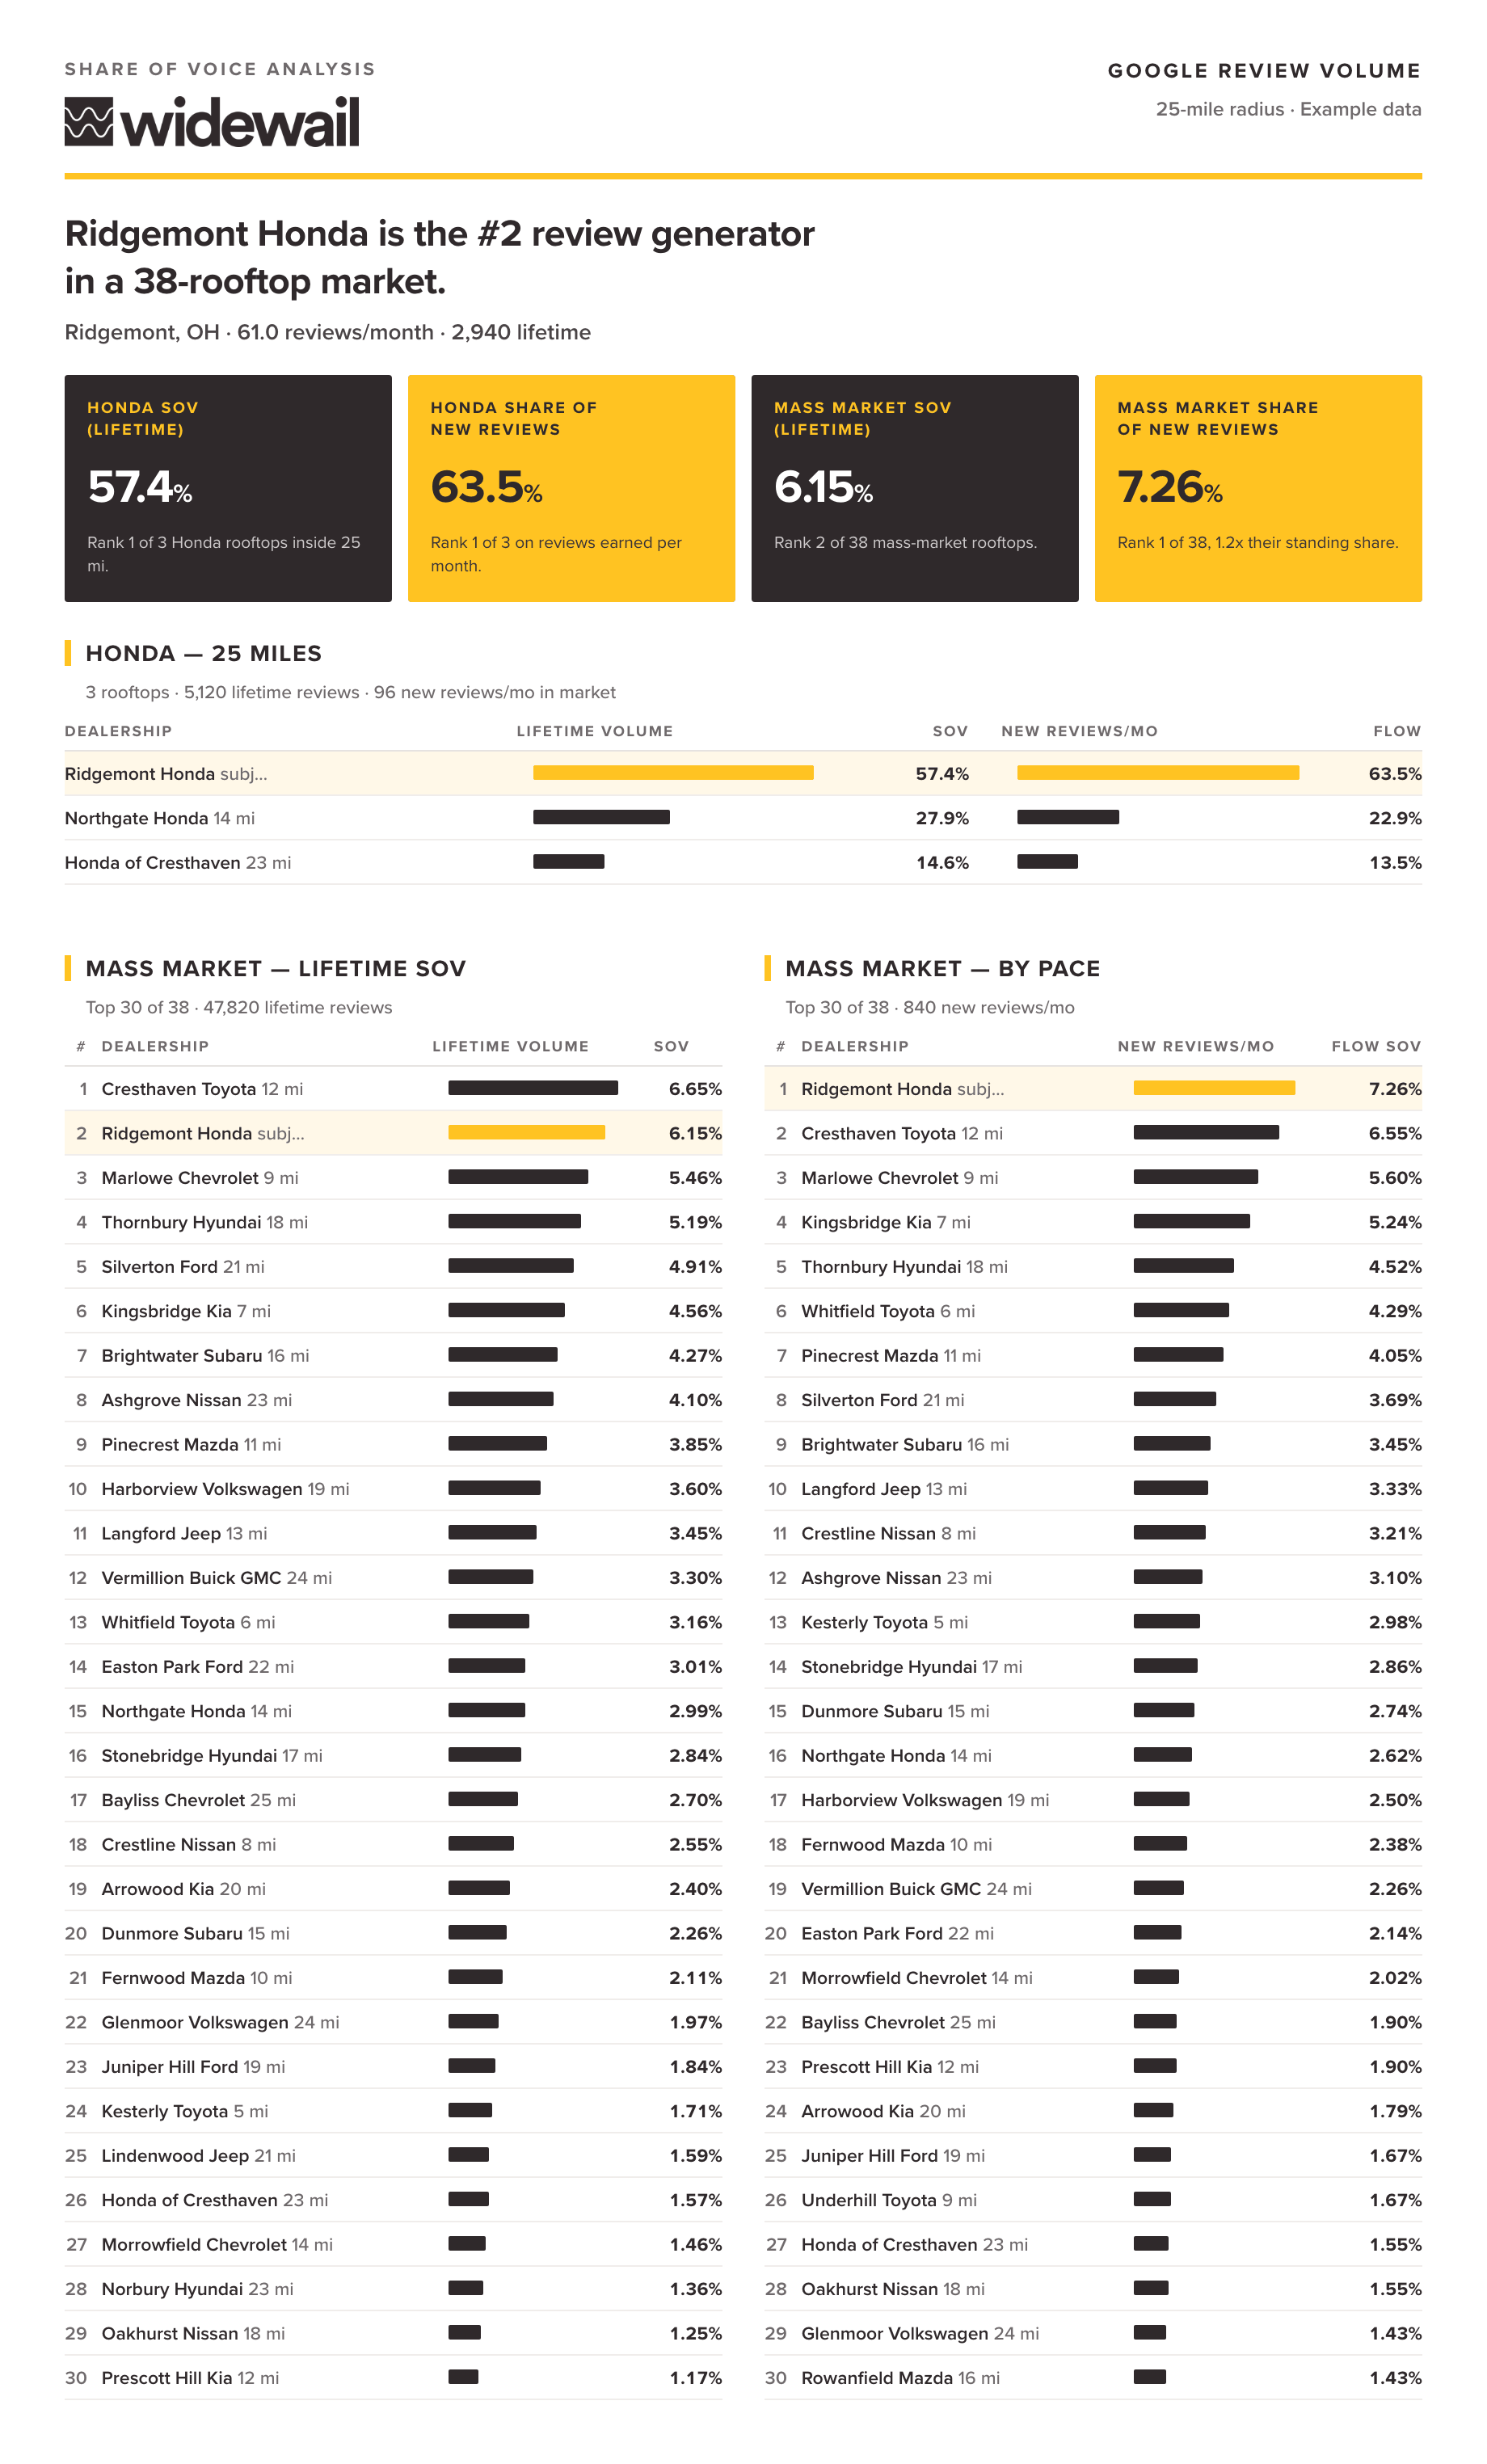
What percentage of all reviews in your radius belong to you, and what percentage of the reviews published this month. When pace runs ahead of lifetime, you are taking share.
Your position among same-brand rooftops nearby, and your position among every franchise dealership in the radius, stated as a rank among named rooftops.
The full list of rooftops in your radius ordered by lifetime volume and again by current pace, with distance from you, so you can see who is out-publishing you right now.
A dealership that owns 75% of its brand's lifetime reviews but 90% of the reviews earned this month is pulling away. One whose pace sits below its lifetime share is giving ground, even while the lifetime number still looks healthy.
| Dealership | Lifetime share | Share of new reviews | Reading |
|---|---|---|---|
| Your rooftop | 75.5% | 89.9% | Taking share, pace well ahead of lifetime |
| Nearby same-brand store | 24.5% | 10.1% | Losing ground against you |
The same comparison runs across every franchise rooftop in the radius, so you can see whether the store taking share from you is the one you expected.
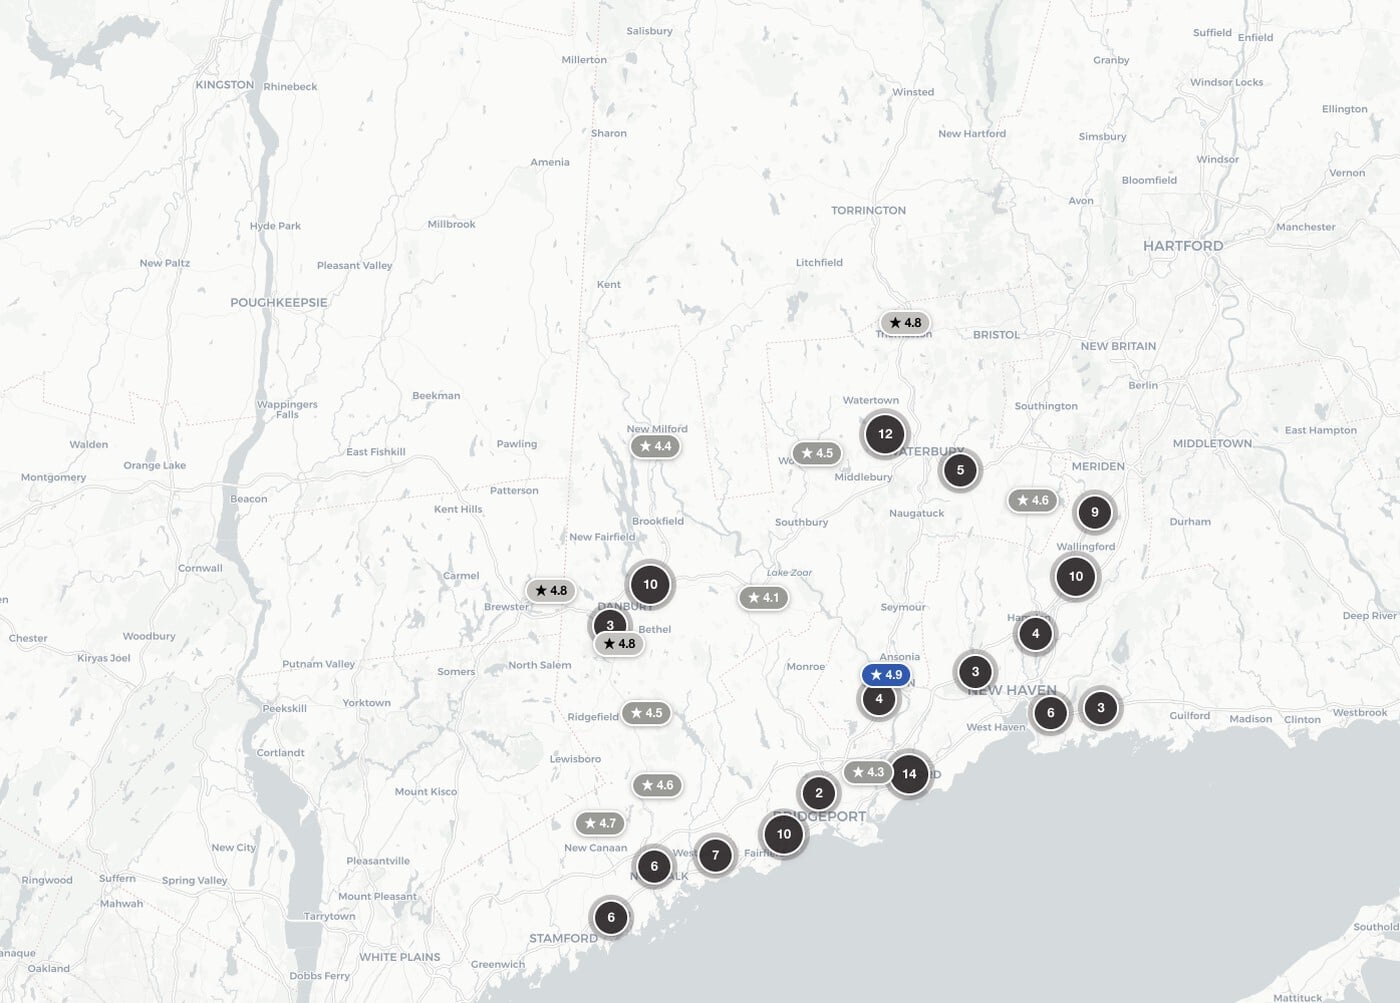
A share of voice report is a photograph of your market on the day we run it. Inside the platform, the same market sits on a live map, with every franchise rooftop pinned by rating and volume, updating as new reviews publish, so you can watch share move instead of asking for it again next quarter.
Filter by brand, segment, or radius. Color shows who is performing above or below you. The ranked list beside the map orders every rooftop by lifetime volume or by current pace, so the store taking share from you is named, not inferred.
Average across Widewail client rooftops. Review volume is compared against non-client rooftops of similar size; rating and negativity benchmarks are industry averages from the Widewail Index, covering 18,000+ U.S. franchise dealerships.
A rating average hides volume. Two stores can both sit at 4.6 while one publishes five times the reviews. Share of voice separates the two.
Run the report for several stores and the pattern shows up fast: the ones holding share, and the ones whose pace has slipped below their lifetime position.
A named competitor earning a measurable multiple of your monthly review volume is a clearer argument than a reputation score with no opponent attached.
| Data source | Public Google review data for the dealerships in your market, drawn from the Widewail Index of 20 million dealership reviews. |
|---|---|
| Market definition | Every franchise rooftop within a 25-mile radius of the address you give us. We can widen or narrow the radius on request. |
| Measures | Lifetime review volume and share, reviews earned per month and share, rank within your brand, and rank across all franchises in the radius. |
| What it is not | It does not contain review text, customer records, or any other dealership's Widewail data. It is a volume and share analysis built from publicly visible reviews. |
| Cost | None, and you do not need to be a Widewail client. |
Your review volume divided by the total review volume of every franchise rooftop in the radius. We report it on lifetime reviews and again on reviews published in the most recent month.
No. The report is built from publicly visible review data, so we can run it for any franchise dealership.
No. The report shows public review counts for the stores in your market. No other dealership's account data, review content, or scorecard is included.
Yes. Tell us the group or the list of stores in the form and we will scope it with you.
We build the analysis for your radius within 24 hours, and a member of the Widewail team reaches out with it to walk you through what it shows. There is no obligation attached.
Tell us the rooftop and its address. The address sets the center of the 25-mile radius, so it is the one detail worth getting exact.
We pull the public Google review data for every franchise rooftop inside your radius and build the analysis. Reports are generated within 24 hours of the request.
Someone from our team sends the report over and walks you through what it shows: where you rank, who is gaining on you, and what is driving the gap. No obligation attached.
One page, your market, every franchise rooftop ranked by review volume.
