To rank dealerships fairly, we take several aspects of a dealership’s online reputation into consideration: monthly and lifetime review volume, average star rating and review response rate. Each of these factors impacts a dealership’s overall ranking differently, which we go into detail about below.
Customer Engagement & Response
When calculating rankings, we consider the percentage of reviews that a dealership has responded to, as Widewail strongly believes that review response is indicative of a strong reputation strategy.
Review Quality & Adjusted Ratings
Our method takes into account the fact that dealerships on our list receive a wide range of monthly review volume, in part due to varying levels of opportunity. For example, luxury brands simply can never sell as many cars as non-luxury brands, the price point limiting a luxury dealership’s market.
To compare two dealerships with very different review volumes directly wouldn’t be fair. A dealer with two 5-star reviews doesn’t necessarily deserve to be ranked higher than a dealer with 200 reviews and a 4.5-star rating. With few reviews, the former doesn’t offer enough data for us to use to understand its performance. However, we couldn’t just ignore locations with very few reviews, as that would introduce bias into our rankings.
To solve this, we used "adjusted ratings" in our calculation of dealership ranking. In essence, "adjusted rating" is a dealership's star rating that takes into account how its review volume compares to that of other dealerships in that area. We calculated adjusted ratings by using a technique called additive smoothing which we explain below.
Additive Smoothing
The approach we’ve used to solve the above issue is a form of what’s called “additive smoothing.” This process allows for an unbiased way to rank two otherwise unequal dealerships. At its core, additive smoothing levels the playing field. It does so by artificially increasing the number of reviews each dealership has and adding the same number of reviews of each star rating to every dealership.
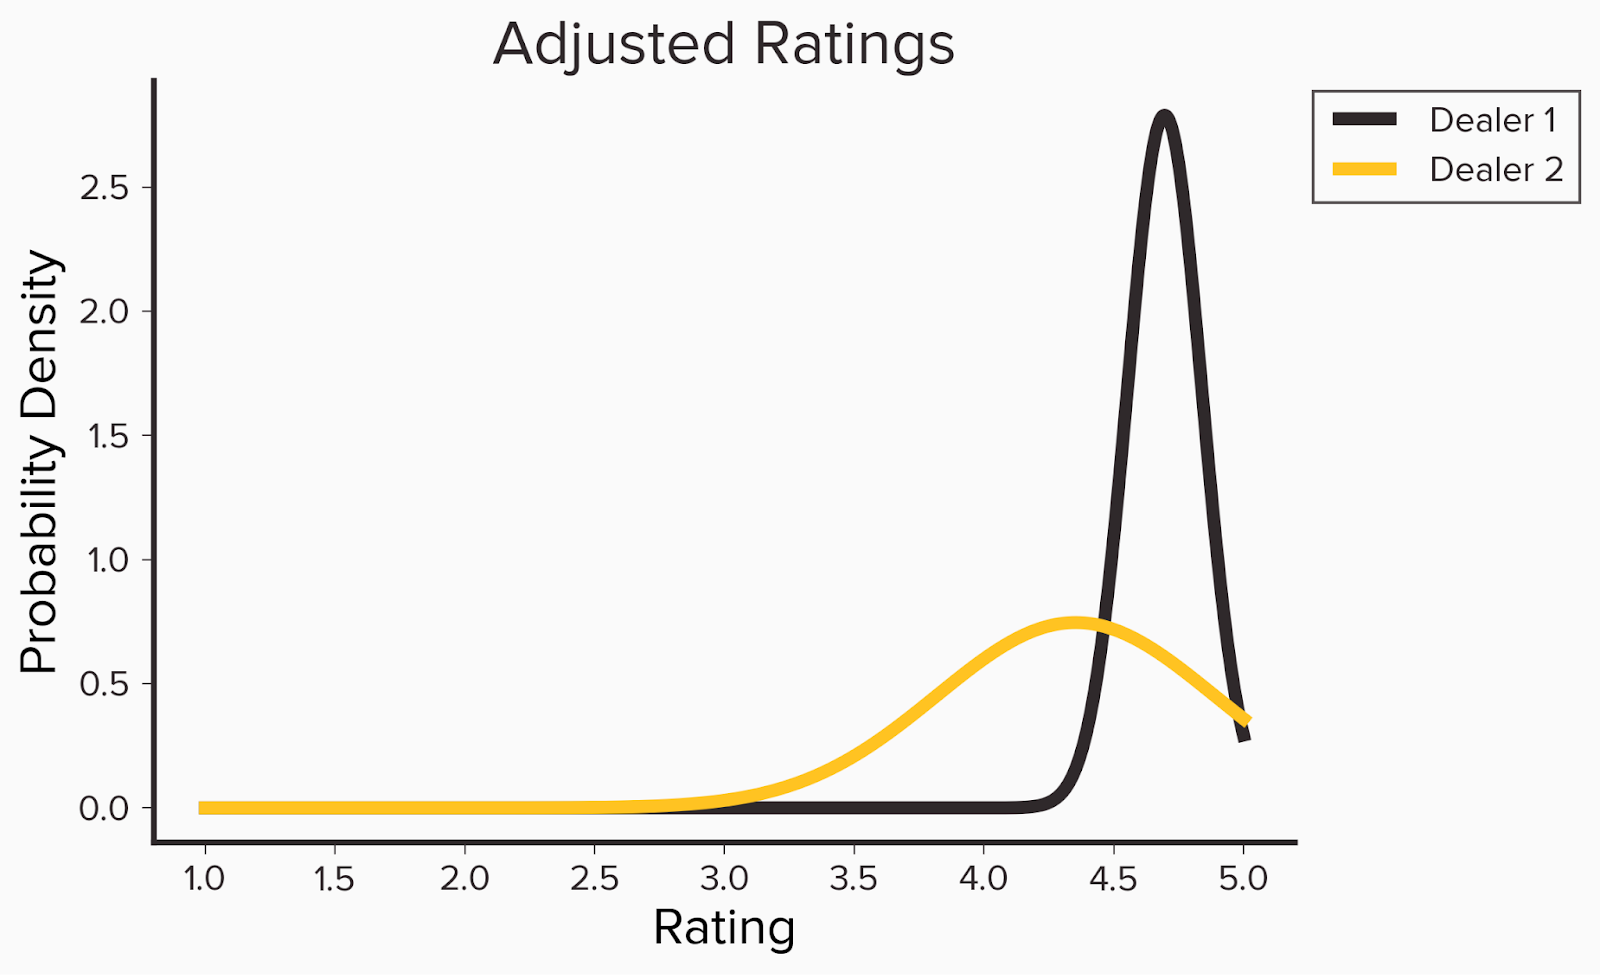
Let’s look at an example. Below, we compare two dealerships, both of which have similar average ratings but vastly different review volumes. Since Dealer 1 has a large volume of reviews, we are more confident their rating truly reflects the experience customers have. On the other hand, Dealer 2 has a much lower review volume. Even though its reviews are overwhelmingly positive, given the limited sample size, there is more uncertainty around whether the average rating reflects the experience customers have.
|
Rating
|
Dealer 1 Volume
|
Dealer 2 Volume
|
|
1
|
12
|
2
|
|
2
|
2
|
1
|
|
3
|
6
|
0
|
|
4
|
28
|
1
|
|
5
|
395
|
49
|
|
Avg
|
4.79
|
4.77
|
|
Adjusted Avg
|
4.7
|
4.35
|
We represent this uncertainty in the plot below. Note how the width of the curve for Dealer 1 is fairly tight, reflecting our confidence about its average rating. We’re less confident about Dealer 2’s adjusted average rating, which is reflected in the wider bell curve.
Activity & Review Volume
The final factor influencing Widewail’s ranking method has to do with how many reviews a dealership receives. This can be broken down into two parts: lifetime volume and average monthly volume.
Lifetime volume tells us how established a company is. It’s one of the first numbers that a potential customer will see when they start browsing a business’s Google Business Profile. Average monthly review volume represents current popularity, showing how active the dealership currently is.
There can be a wide variability of monthly review volume and lifetime review volume within a given city/region. We wanted to ensure that our rankings were able to capture the variability in review volume so we scaled volume metrics–a strategy we’ll explain below.
Instead of using the raw volume for monthly review volume and lifetime review volume, we use a scaled value so there is a more meaningful comparison. To do this we use what is referred to as min-max scaling. We start by grouping dealerships by their city. Then, we find the dealer with the highest review volume and the smallest and then adjust each dealership’s volume, so that dealerships can be meaningfully compared on a smaller scale (0-1). We use the following formula.
x' = x - min(x)max(x) - min(x)
The main advantages of this approach are that all the volume metrics can be mapped to a value between 0 and 1 and the relative difference between dealership volumes can still be preserved.
To illustrate this, imagine we have 9 dealerships with differing lifetime volumes. Dealer A has the greatest volume (4,619-lifetime reviews,) and dealer I has the least number of reviews (just 22). So, we set our minimum value to be 22 and our maximum value to be 4,619. To start calculating, we subtract the minimum value of 22 from each dealer’s lifetime volume (LV- min). Then we divide the resulting value by the difference between our maximum and minimum values (4,619 - 22 = 4597). The final column is our new scaled value.
|
Dealer
|
Lifetime Volume (LV)
|
LV - min
|
(LV - min) / (max - min)
|
|
A
|
4619
|
4597
|
1
|
|
B
|
4065
|
4043
|
0.8795
|
|
C
|
3922
|
3900
|
0.8484
|
|
D
|
1783
|
1761
|
0.3831
|
|
E
|
1001
|
979
|
0.2130
|
|
F
|
810
|
788
|
0.1714
|
|
G
|
164
|
142
|
0.0309
|
|
H
|
101
|
79
|
0.0172
|
|
I
|
22
|
0
|
0
|
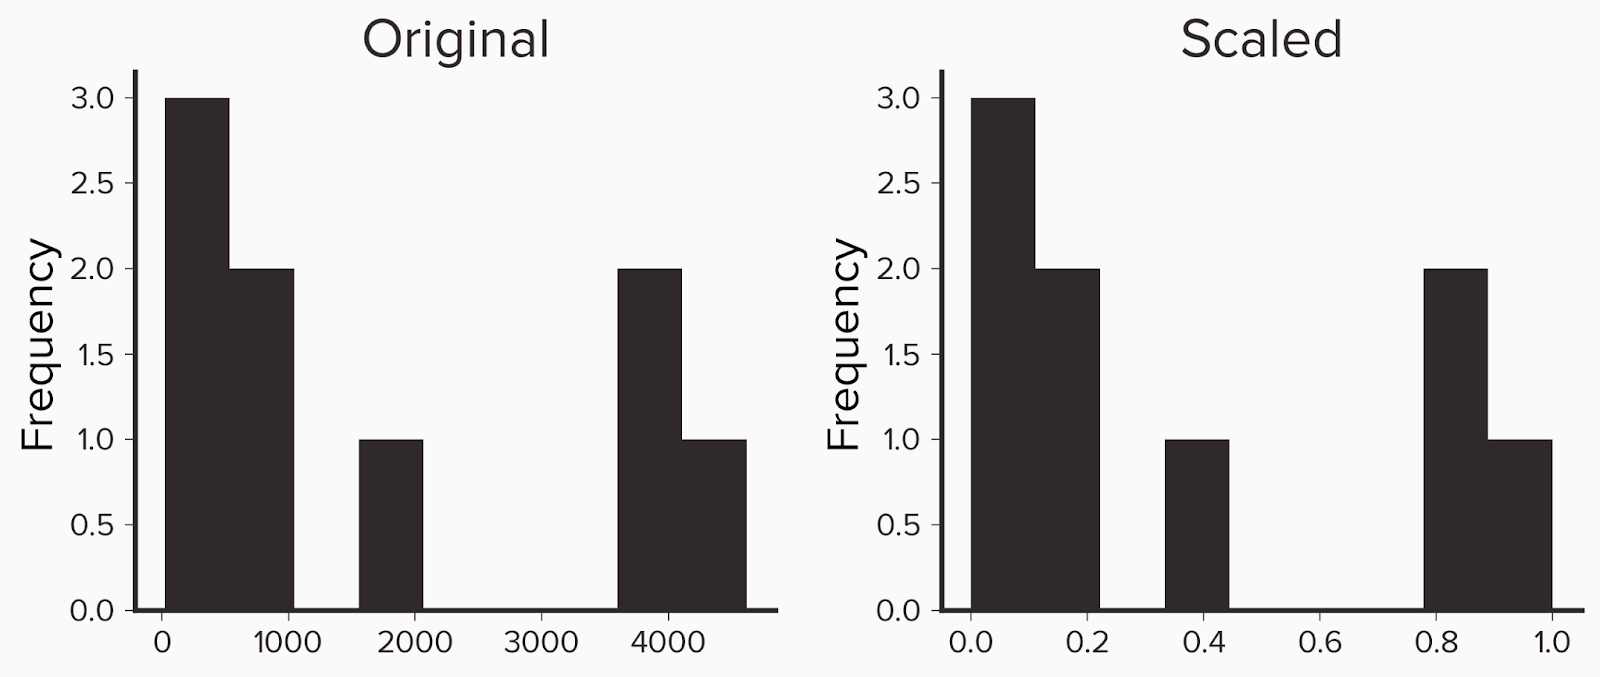
In the two charts below, notice that the relative distance between the original volumes and the scaled versions is the same. This means that the percent change in review volume between dealers is the same whether we look at the lifetime volume or the scaled version. We can also see this in the distribution of volume, where the original volume and scaled versions have the same shape - preserving the original structure of the data.
The Ranking Formula
(adjusted rating / 5) * 0.3 + (response rate) * 0.3 + (lifetime volume) * 0.15 + (avg monthly volume) * 0.25
Weighting Rational
Weight selection is based on Widewail’s depth of expertise in the industry, and we believe it is a fair representation of what should be considered a standout reputation.
We’ve broken the weights into three categories:
Customer Engagement & Response (30%)
Engaging with customers by responding to reviews is a key component of a healthy reputation.
Review Quality & Rating (30%)
Rating has a substantial impact on if a business shows up in local searches and if that business is entered into a prospect’s consideration set. Rating is a key identifier of business health.
Activity & Review Volume (40%)
We believe the amount of review activity is the most important indicator of reputation health for a business, and it is a leading driver of local search rankings. We’ve broken this category into two components: lifetime volume (15%) and frequency (25%).
Calculation Example
If a company that has an adjusted rating of 4.2, responds to 10% of their reviews and is ranked in the 90th percentile for their lifetime volume in their city and the 87th percentile for their average monthly review volume, then we would calculate their overall rating as follows:
(4.2 / 5) * 0.3 + (0.1)*0.3 + (0.9)*0.15 + (0.87)*0.25 = 0.252 + 0.03 + 0.135 + 0.2175 = 0.6345 * 100 = 63.45
Note: Since response rate accounts for 30% of the overall ranking, if a dealer doesn’t respond to any reviews that automatically caps the max value they can receive to 70.