Los Angeles is the most populous city in California. Famous for its film and TV industries, as well as iconic neighborhoods such as Hollywood and Venice Beach, California is also home to a thriving automotive market of luxury and non-luxury automotive dealers.
The first company to manufacture motor vehicles in LA was the Auto Vehicle Company, which produced 3,000 vehicles before shut down in 1910. LA’s auto manufacturing surged from the 1940s through the 60s. The city produced half a million automobiles annually under the famous companies Chrysler, Ford, GM, and Jeep. These companies employed over 15,000 workers at the peak of manufacturing.
At one time, LA nearly rivaled Detroit for the top producer in the nation. While auto manufacturing in LA has since declined, the city has a competitive automotive dealership industry. In 2024, LA dealerships showcase strong review response rates, high Google star ratings, and significant review volume. To earn the best reputation in Los Angeles, dealers must provide top-notch service while remaining committed to the customer experience.
Using the Automotive Reputation Index, which ranks dealers by volume, rating, and response rate, we’ve identified the Los Angeles dealerships with the best online reputations.

-
Honda of Downton Los Angeles has secured the top-ranking dealer in LA with an overall health score of 92, nearly 20 points higher than the second dealer on the list, Nissan of Downtown LA. Honda Downtown Los Angeles has earned the best reputation in LA largely due to its relative monthly review volume, which is more than double that of any other dealer in the rankings.
-
Kia of Downtown Los Angeles has secured the #6 spot on the list. Interestingly, it has the lowest average Google rating (3.5 stars) and one of the lowest response rates (88%) of dealers in LA. This dealer could improve its ranking by committing to a more dedicated customer service strategy and asking for more reviews.
-
Tying for seventh place, Porsche Downtown LA has significant room for improvement. To rise in the rankings, this dealer should focus on improving its monthly review volume, which will in turn raise its lifetime review volume.

-
Beverly Hills BMW solidifies itself as the #1 luxury dealer in LA, skyrocketing past the others with a health score of 95. Most notably, this dealer dominates in the relative monthly and lifetime review volume categories.
-
Mercedes-Benz of Los Angeles and Nick Alexander Imports rank 4th and 5th in the luxury dealer rankings, respectively. Low review response rates suppress both dealers' rankings. Partnering with an online engagement partner like Widewail to manage online engagement efforts, or responding to all reviews moving forward, would drastically improve these dealers' online reputations.

-
Honda of Downtown Los Angeles again secures the top spot of non-luxury dealers, primarily due to its robust monthly and lifetime review volumes.
-
The rest of the top 5 non-luxury dealers rank competitively, with just 9 points between the health scores of Nissan of Downtown LA (#2 ranked) and Kia of Downtown Los Angeles (#5 ranked). To improve and to stand a chance at dethroning Honda of Downtown Los Angeles, these dealers need to maintain high review response rates and invest in increasing their monthly review volumes.
*Note from the editor. The Automotive Reputation Index offers substantial coverage of the nation’s dealerships, but it’s still growing. If your dealership is not yet listed on the Index and you’d like to add it, submit your information and we will add it during a regularly scheduled update, roughly once per month.
Widewail's rankings are based on the Widewail Automotive Reputation Index. Explore the full dataset:

Ranking Methodology
To rank these dealerships fairly, we chose a method that takes into account the fact that dealerships on our list receive a wide range of monthly review volume, in part due to varying levels of opportunity. For example, luxury brands simply can never sell as many cars as non-luxury brands, the price point limiting a luxury dealership's market.
To compare two dealerships with very different review volumes directly wouldn’t be fair. A dealer with two 5-star reviews doesn’t necessarily deserve to be ranked higher than a dealer with 200 reviews and a 4.5-star rating. With few reviews, the former doesn’t offer enough data for us to use to understand its performance. However, we couldn’t just ignore locations with very few reviews, as that would introduce bias into our rankings.
To solve this, we used "adjusted ratings" in our calculation of dealership ranking. In essence, "adjusted rating" is a dealership's star rating that takes into account how its review volume compares to that of other dealerships in that area. We calculated adjusted ratings by using a technique called additive smoothing which we explain below.
Additive Smoothing
The approach we’ve used is a form of what’s called “additive smoothing.” This process allows for an unbiased way to rank two otherwise unequal dealerships. At its core, additive smoothing levels the playing field by artificially increasing the number of reviews each dealership has by adding the same number of reviews of each star rating to every dealership.
Customer Engagement
Additionally, we take into account the percentage of reviews that a dealership has responded to in our calculation of ranking, as Widewail strongly believes that review response is indicative of a strong reputation strategy.
Activity
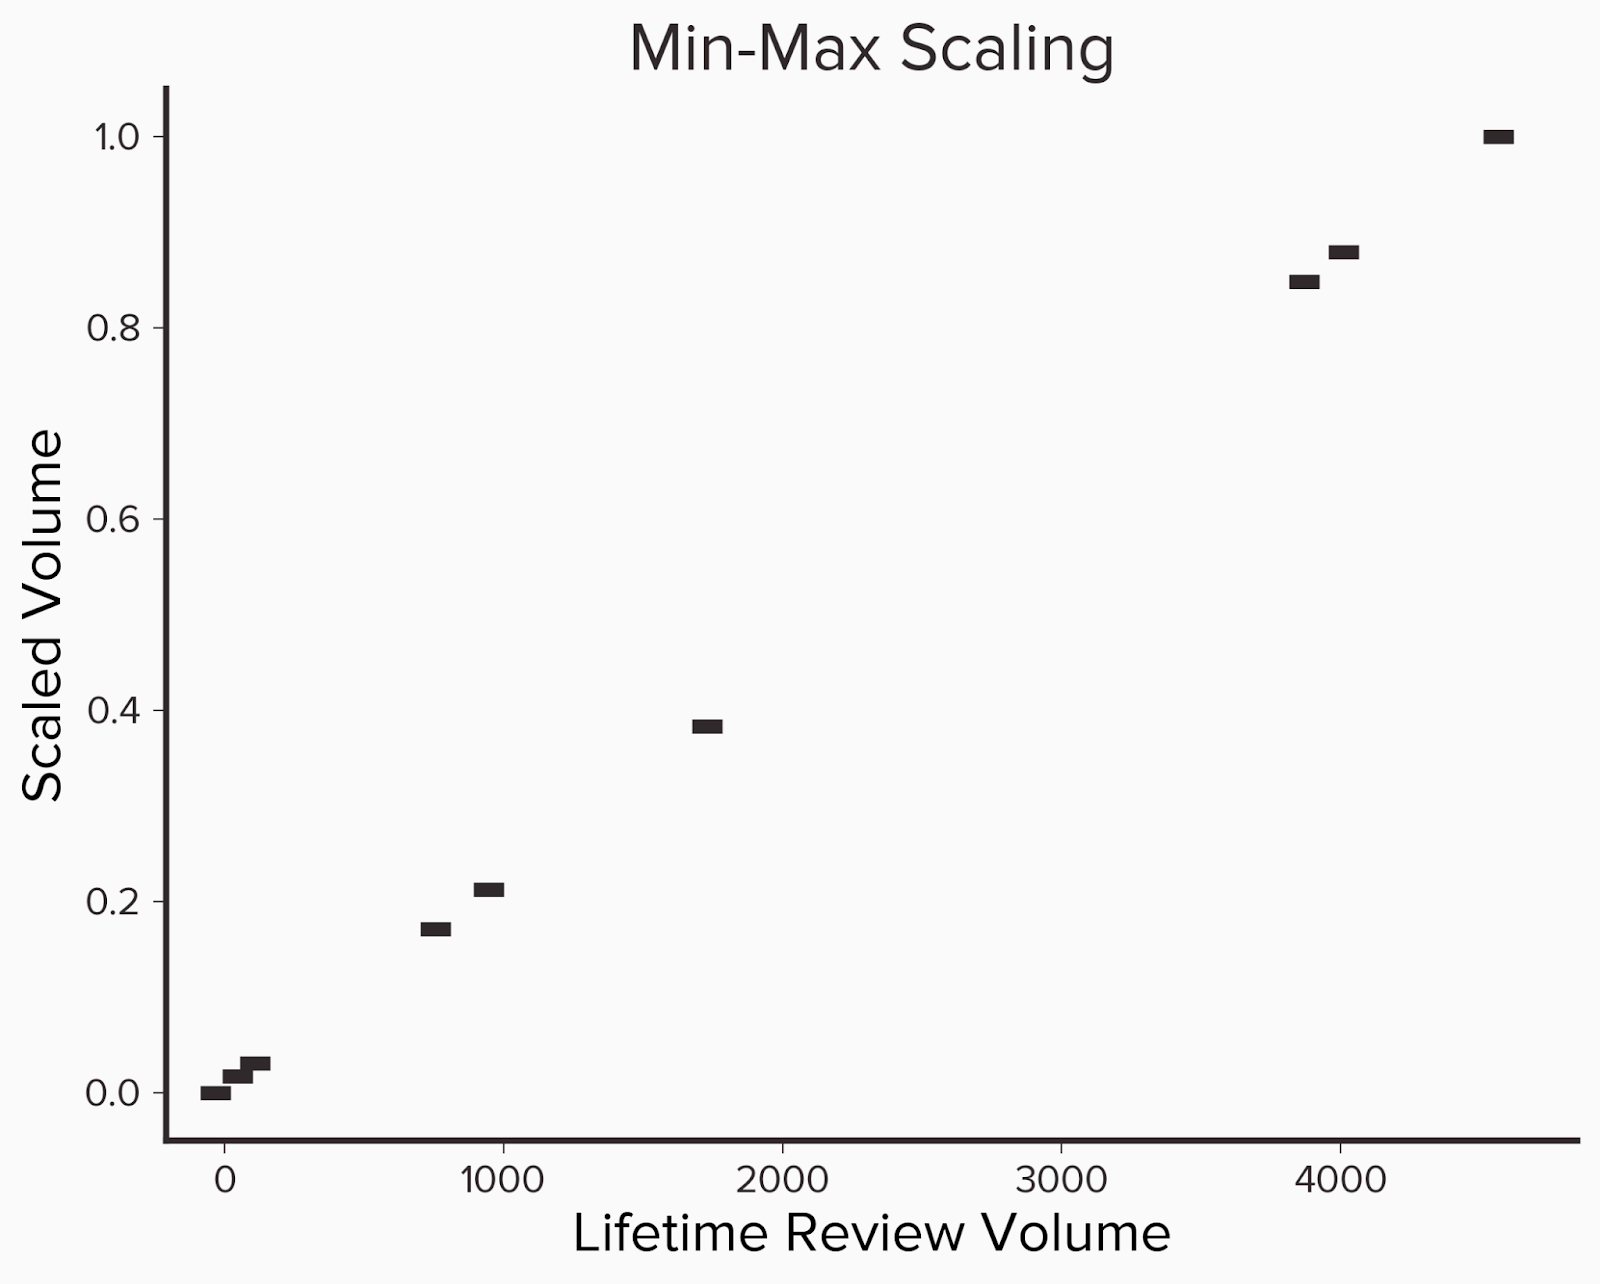
The last component revolves around how much review volume a dealership receives, which can be broken down into two parts - their lifetime volume and average monthly volume. Lifetime volume can be thought of as a popularity metric. It’s an important metric and one of the first numbers that a potential customer will see when they start looking at reviews. The second, average monthly review volume, is representative of how active the dealership currently is. We can think of it as follows, lifetime volume captures a historical view of the dealership whereas average volume gives insight into the current status. The final component for the volume metrics is to scale them so there is a more meaningful comparison. To do this we use what is known as min-max scaling. First, we group dealerships by their respective city and then find the dealership with the most volume and least volume. Then for each dealer in the group, we subtract the lowest volume and divide by the difference between the highest and lowest volume. The formula for this can be seen below.
x' = x - min(x)max(x) - min(x)
The main advantages of this approach are that all the volume metrics can be mapped to a value between 0 and 1 and the relative difference between dealership volumes can still be preserved.
Below we see an example of this where we have 9 dealerships with differing lifetime volumes, which we then scale. Notice that the relative distance between the actual volumes and the scaled versions is the same.
Below we have an example of ten dealerships, their review volume, and the adjusted relative volume. We can calculate the relative volume by sorting the dealers by review volume and determining the percentage of dealers that have fewer reviews. Here we see that dealer D had the most reviews and so they get a score of 1.
|
Lifetime Volume
|
Scaled Volume
|
|
4619
|
1
|
|
4065
|
0.88
|
|
3922
|
0.85
|
|
1783
|
0.38
|
|
1001
|
0.21
|
|
810
|
0.17
|
|
164
|
0.03
|
|
101
|
0.02
|
|
22
|
0
|
The Ranking Formula
(adjusted rating / 5) * 0.3 + (response rate) * 0.3 + (lifetime volume) * 0.15 + (avg monthly volume) * 0.25
Weighting Rational
We chose to weigh each feature as follows: adjusted rating accounts for 30% of the overall score, response rate also accounts for 30%, and review volume is 40%, which is further broken down into lifetime volume (15%) and average monthly volume (25%).
Weight selection is based on Widewail’s depth of expertise in the industry and we believe is a fair representation of what should be considered a standout reputation.
We’ve broken the weighs into three categories:
Activity (40%)
We believe the amount of review activity is the most important indicator of reputation health for a business, and is a leading driver of local search rankings. We’ve broken this category into two components: lifetime volume (15%) and frequency (25%). Lifetime volume is our “popularity” metric.
Engagement (30%)
Engaging with customers by responding to reviews is a key component of a healthy reputation.
Quality (30%)
The rating has a substantial impact on if a business shows up in local search and if that business is entered into a prospect’s consideration set. Rating is a key identifier of business health.
Calculation Details
If a company has an adjusted rating of 4.2, responds to 10% of their reviews and has an adjusted lifetime volume of 0.90 in their city and 0.87 for their scaled average monthly review volume, then we would calculate their overall rating as follows
(4.2 / 5) * 0.3 + (0.1)*0.3 + (0.9)*0.15 + (0.87)*0.25 = 0.252 + 0.03 + 0.135 + 0.2175 = 0.6345 * 100 = 63.45
Note: Since response rate accounts for 30% of the overall ranking, if a dealer doesn’t respond to any reviews that automatically caps the max value they can receive to 70.