San Diego, California is known for its beautiful weather, beaches, parks, and family attractions. It is the second most populated city in the state and is sometimes referred to as "the Birthplace of California", as it was the first site settled by Europe on the US’s west coast.
San Diego takes pride in its automotive history, as shown via the San Diego Automotive Museum. The museum was inspired by Briggs Cunningham, a local automobile collector and racer, and was built in Balboa Park, a historic section of San Diego. Its automotive displays pay homage to automobile culture and history in the Southern California region.
San Diego’s love for cars has yielded a competitive automotive market today. In San Diego, dealerships showcase strong review response rates, high Google star ratings, and significant review volume.
Using the Automotive Reputation Index, which ranks dealers by volume, rating, and response rate, we’ve identified the San Diego dealerships with the best online reputations.
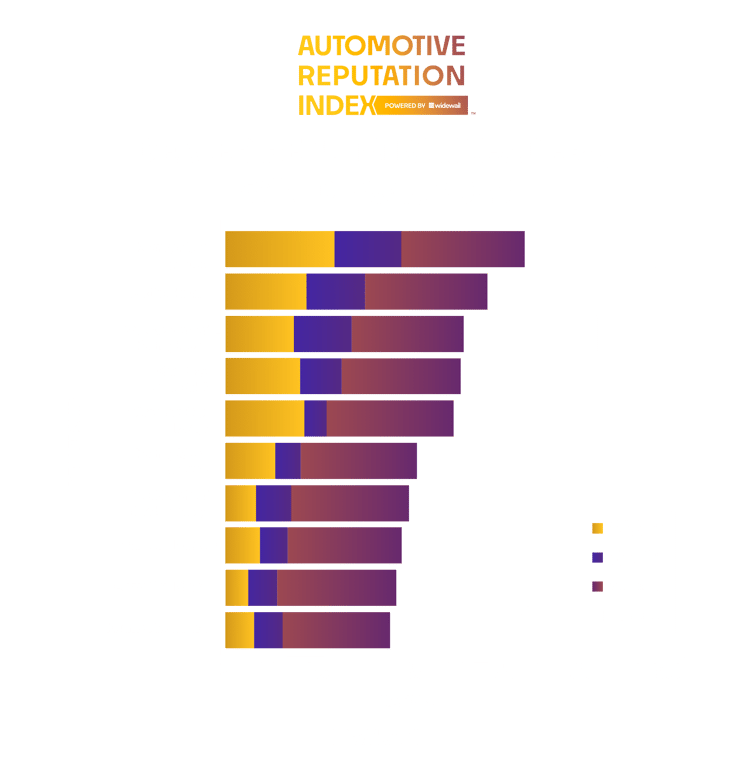
- Of all dealers–luxury and non-luxury–Kearny Mesa Hyundai earns the #1 spot. It has the highest volume of reviews per month and highest lifetime volume of the dealers on the list. While it does not have the highest adjusted rating nor response rate of the group, Kearny Mesa Hyundai is still 8 points ahead of the second on the list.
- A common theme amongst all dealers is their near perfect response rate. No dealer in the top 10 responds to fewer than 97% of their incoming reviews. If other dealers want to break into the top 10, they’ll need to make sure they’re engaging their customers.
- In the 10th spot is Kearny Mesa Ford. Hurting the store most is its low monthly volume and adjusted rating. A dealership with otherwise a strong response rate, the store could work on driving more reviews per month to boost its ranking.
- Non-luxury dealers in San Diego tend to outrank luxury dealers in the area. The reality is that non-luxury dealers likely sell more cars and have a greater customer base to solicit reviews from. To improve, luxury dealers can look for more opportunities to ask for reviews, such as after service visits, after test drives and after customers book future service appointments.
- All San Diego dealerships could improve on getting more reviews. A cornerstone of online reputation management, generating more reviews should help increase the average rating of many dealers.

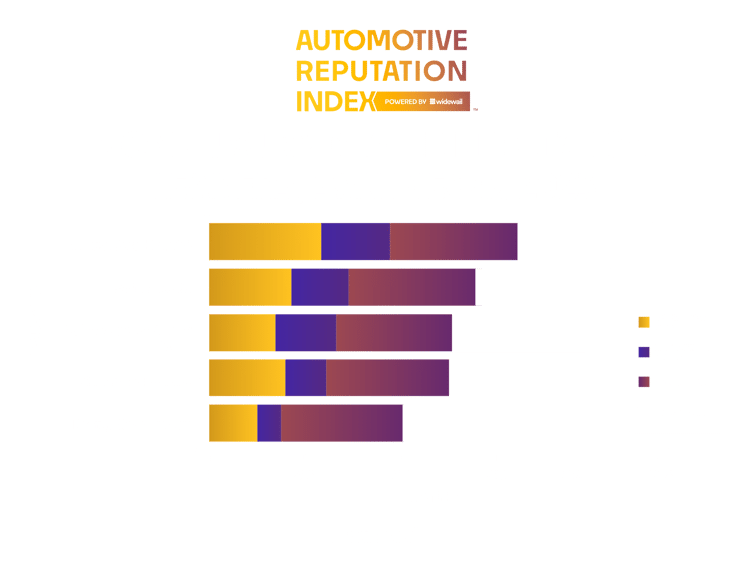
- Volvo Cars San Diego earns the top spot of luxury dealers in San Diego for its superior monthly review volume. Despite the fact that Audi San Diego actually has a greater lifetime volume of reviews, Volvo Cars San Diego gets many more reviews per month than the Audi dealership, which demonstrates a high volume of engaged customers.
- BMW of San Diego has the highest lifetime volume of reviews of luxury dealers in this area. Despite this, the dealership is #4 on the list. To move higher, this dealer should boost its monthly review volume by finding more opportunities to ask for reviews.
- Monthly review volume is important and that’s evidenced by Kearny Mesa Hyundai which earned the #1 ranking for non-luxury dealers, primarily because of its strong monthly review volume. This dealer gets a similar adjusted rating as other top non-luxury dealers but the sheer volume of new reviews it receives puts it at the top.
- Courtesy Chevrolet has a notably lower lifetime volume than the dealer that ranks above it, Volkswagen of Kearny Mesa. However, Courtesy Chevrolet gets more monthly reviews than the Volkswagen store. Unless the Volkswagen dealership boosts its monthly review volume, the Chevrolet dealership may outrank it soon.
*Note from the editor. The Automotive Reputation Index offers substantial coverage of the nation’s dealerships, but it’s still growing. If your dealership is not yet listed on the Index and you’d like to add it, submit your information and we will add it during a regularly scheduled update, roughly once per month.
Widewail's rankings are based on the Widewail Automotive Reputation Index. Explore the full dataset:

Ranking Methodology
To rank these dealerships fairly, we chose a method that considers the fact that dealerships on our list receive a wide range of monthly review volume, in part due to varying levels of opportunity. For example, luxury brands can never sell as many cars as non-luxury brands, the price point limiting a luxury dealership's market.
To compare two dealerships with very different review volumes directly wouldn’t be fair. A dealer with two 5-star reviews doesn’t necessarily deserve to be ranked higher than a dealer with 200 reviews and a 4.5-star rating. With few reviews, the former doesn’t offer enough data for us to use to understand its performance. However, we couldn’t just ignore locations with very few reviews, as that would introduce bias into our rankings.
To solve this, we used "adjusted ratings" in our calculation of dealership ranking. In essence, "adjusted rating" is a dealership's star rating that takes into account how its review volume compares to that of other dealerships in that area. We calculated adjusted ratings by using a technique called additive smoothing which we explain below.
Additive Smoothing
The approach we’ve used is a form of what’s called “additive smoothing.” This process allows for an unbiased way to rank two otherwise unequal dealerships. At its core, additive smoothing levels the playing field by artificially increasing the number of reviews each dealership has by adding the same number of reviews of each star rating to every dealership.
Customer Engagement
Additionally, we take into account the percentage of reviews that a dealership has responded to in our calculation of ranking, as Widewail strongly believes that review response is indicative of a strong reputation strategy.
Activity
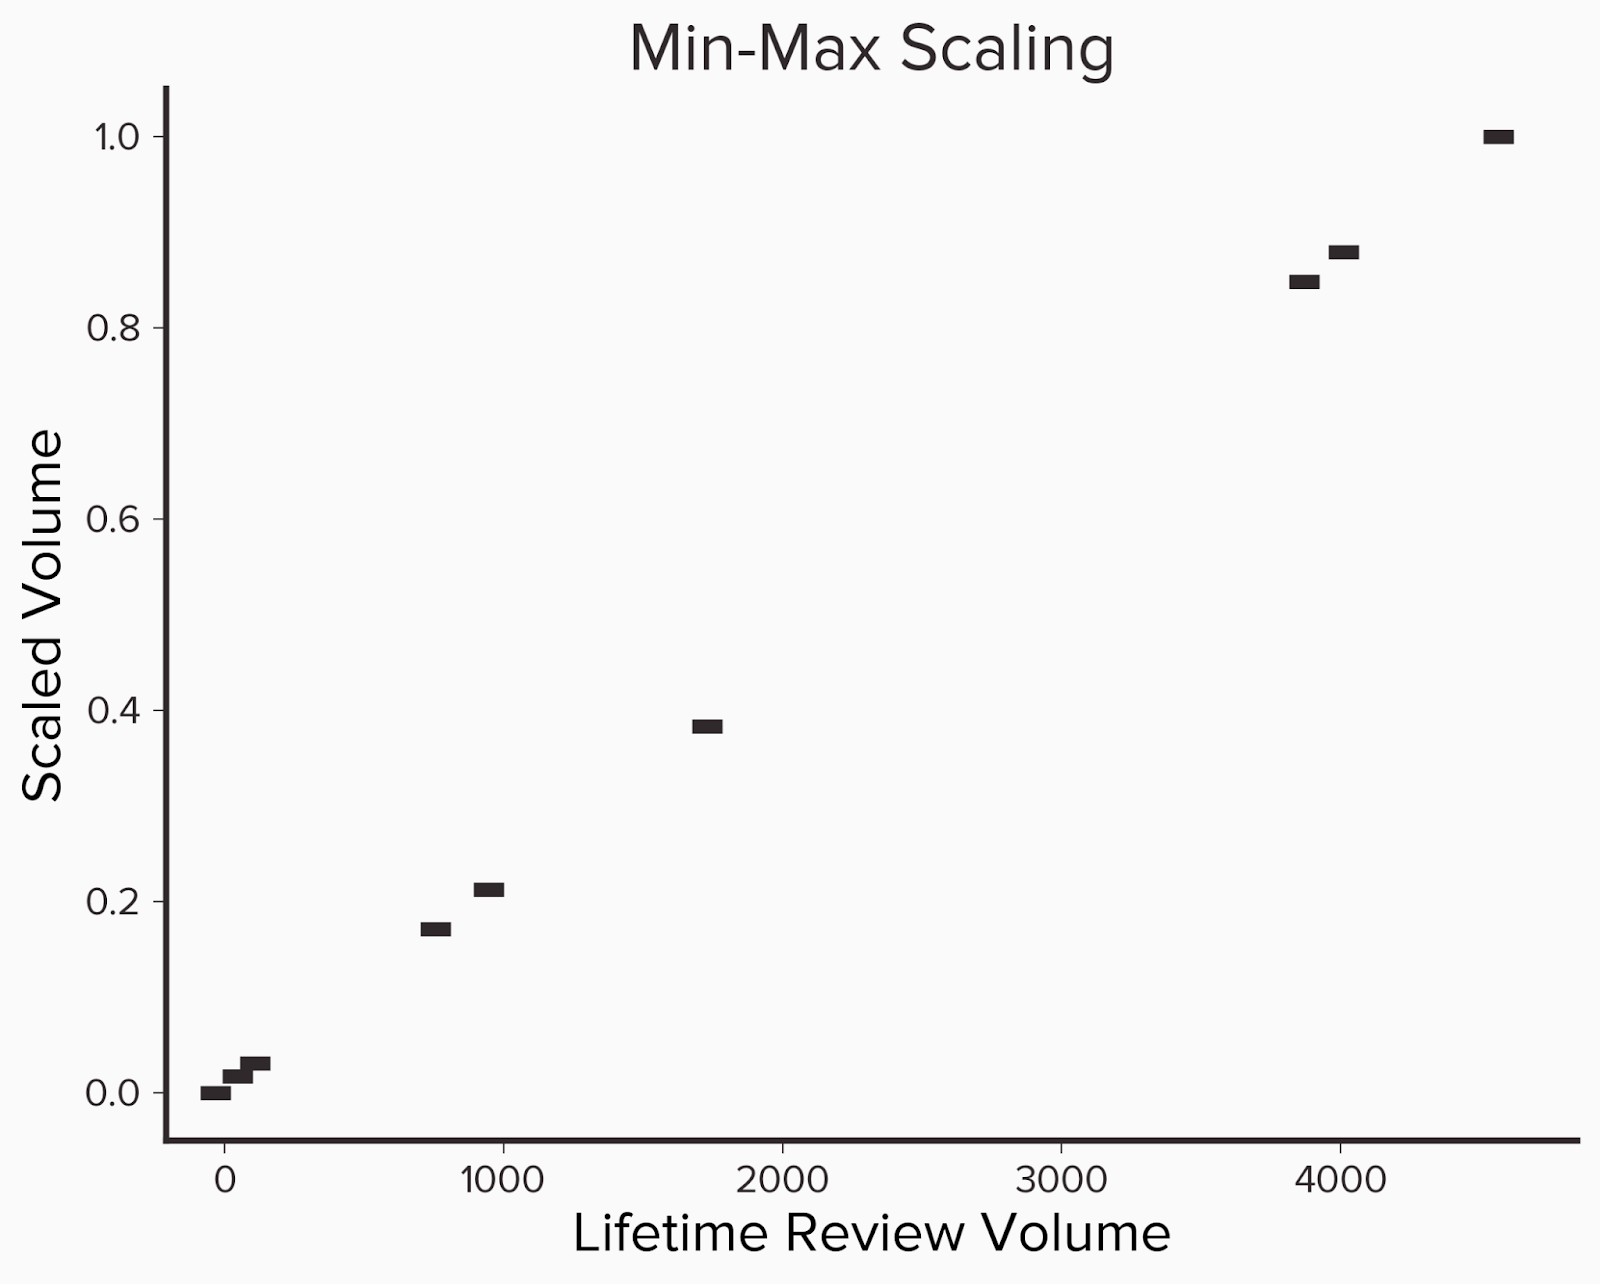
The last component revolves around how much review volume a dealership receives, which can be broken down into two parts - their lifetime volume and average monthly volume. Lifetime volume can be thought of as a popularity metric. It’s an important metric and one of the first numbers that a potential customer will see when they start looking at reviews. The second, average monthly review volume, is representative of how active the dealership currently is. We can think of it as follows, lifetime volume captures a historical view of the dealership whereas average volume gives insight into the current status. The final component for the volume metrics is to scale them so there is a more meaningful comparison. To do this we use what is known as min-max scaling. First we group dealerships by their respective city and then find the dealership with the most volume and least volume. Then for each dealer in the group, we subtract the lowest volume and divide by the difference between the highest and lowest volume. The formula for this can be seen below.
x' = x - min(x)max(x) - min(x)
The main advantages of this approach are that all the volume metrics can be mapped to a value between 0 and 1 and the relative difference between dealership volumes can still be preserved.
Below we see an example of this where we have 9 dealerships with differing lifetime volumes, which we then scale. Notice that the relative distance between the actual volumes and the scaled versions is the same.
Below we have an example of ten dealerships, their review volume, and the adjusted relative volume. We can calculate the relative volume by sorting the dealers by review volume and determining the percentage of dealers that have fewer reviews. Here we see that dealer D had the most reviews and so they get a score of 1.
|
Lifetime Volume
|
Scaled Volume
|
|
4619
|
1
|
|
4065
|
0.88
|
|
3922
|
0.85
|
|
1783
|
0.38
|
|
1001
|
0.21
|
|
810
|
0.17
|
|
164
|
0.03
|
|
101
|
0.02
|
|
22
|
0
|
The Ranking Formula
(adjusted rating / 5) * 0.3 + (response rate) * 0.3 + (lifetime volume) * 0.15 + (avg monthly volume) * 0.25
Weighting Rational
We chose to weigh each feature as follows: adjusted rating accounts for 30% of the overall score, response rate also accounts for 30%, and review volume is 40%, which is further broken down into lifetime volume (15%) and average monthly volume (25%).
Weight selection is based on Widewail’s depth of expertise in the industry and we believe is a fair representation of what should be considered a standout reputation.
We’ve broken the weighs into three categories:
Activity (40%)
We believe the amount of review activity is the most important indicator of reputation health for a business, and is a leading driver of local search rankings. We’ve broken this category into two components: lifetime volume (15%) and frequency (25%). Lifetime volume is our “popularity” metric.
Engagement (30%)
Engaging with customers by responding to reviews is a key component of a healthy reputation.
Quality (30%)
Rating has a substantial impact on if a business shows up in local searches and if that business is entered into a prospect’s consideration set. Rating is a key identifier of business health.
Calculation Details
If a company has an adjusted rating of 4.2, responds to 10% of their reviews and has an adjusted lifetime volume of 0.90 in their city and 0.87 for their scaled average monthly review volume, then we would calculate their overall rating as follows
(4.2 / 5) * 0.3 + (0.1)*0.3 + (0.9)*0.15 + (0.87)*0.25 = 0.252 + 0.03 + 0.135 + 0.2175 = 0.6345 * 100 = 63.45
Note: Since response rate accounts for 30% of the overall ranking, if a dealer doesn’t respond to any reviews that automatically caps the max value they can receive to 70.