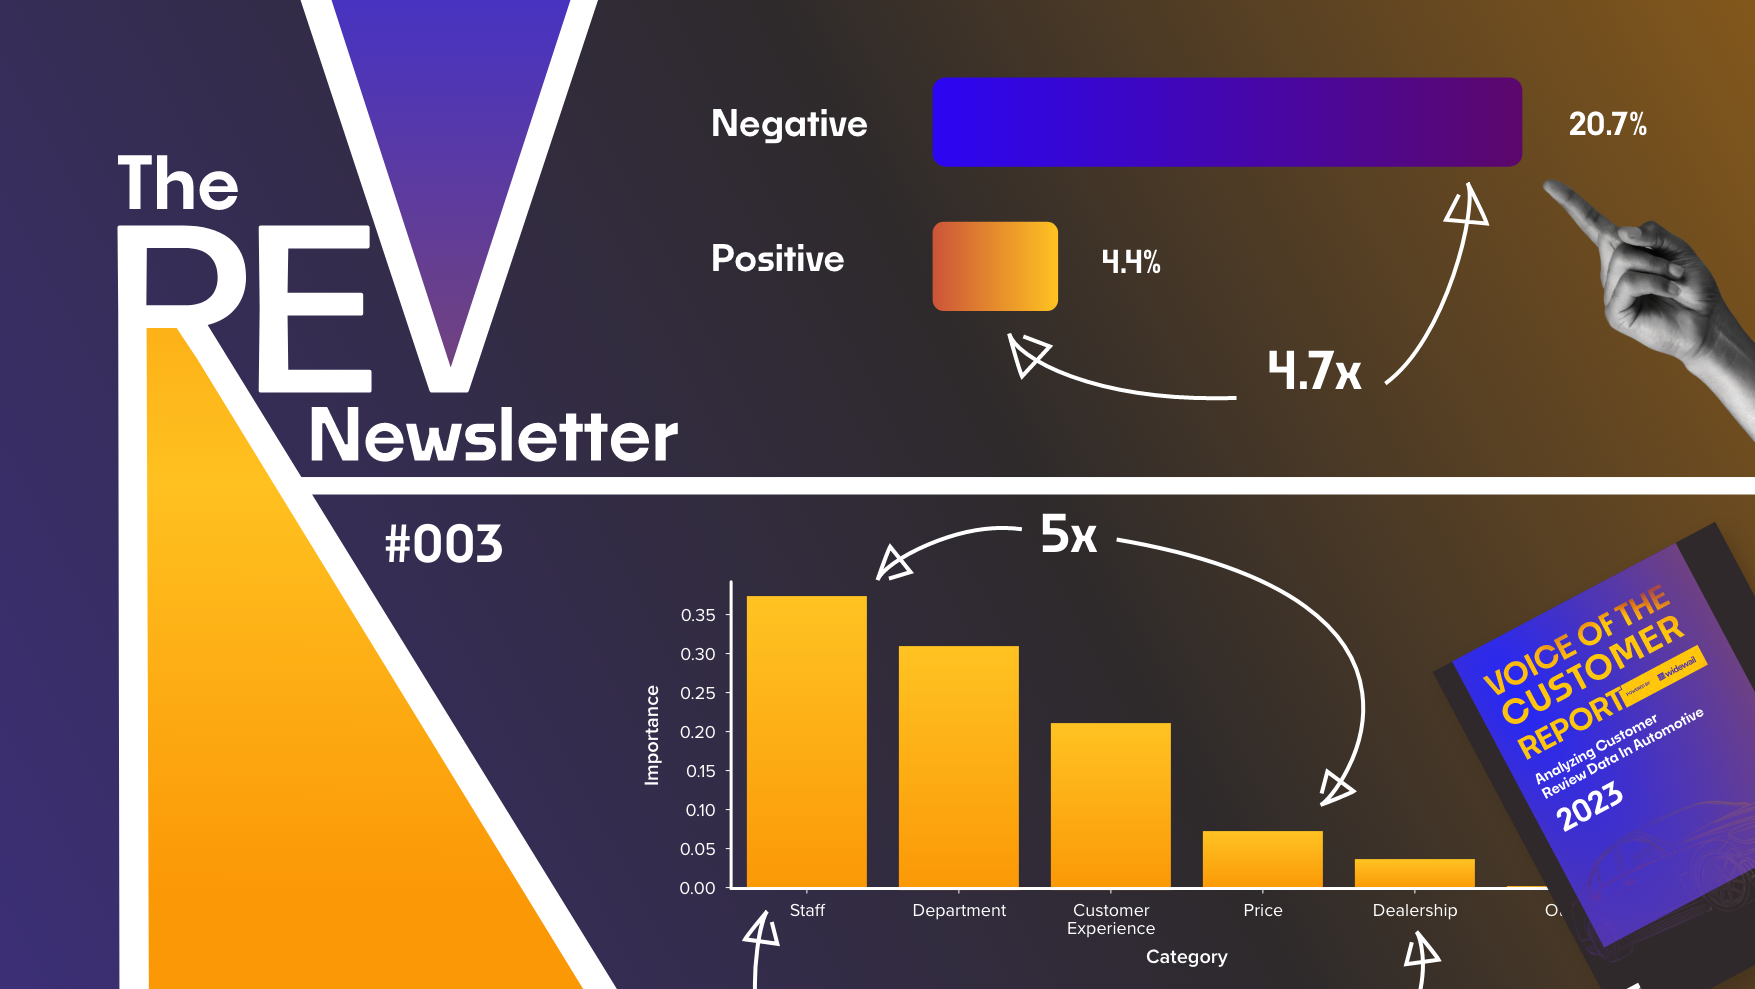
Welcome to the REV. A briefing that goes deep into the Widewail Automotive Reputation Index data, surfacing the most interesting insights. Every 3 weeks we Rank, Explore & Visualize automotive reputation & sentiment data.
All data is sourced from the Widewail Automotive Reputation Index (unless noted). The Index aggregates over 1.6 million Google reviews from 16k new car dealerships in the U.S. Customize the dataset like it's your own personal spreadsheet. Try it out. It’s free.
For REV #003, all data is sourced from our latest market research report: 2023 Voice of the Customer Report.
RANK
Frost-E(v)
Ask any random person on the street what they think of car dealers and the response will probably trend negative.
Looking at Google reviews, though, we mostly see happy customers represented. On average, 90% of dealership reviews are positive (4 and 5 stars).
However, one burgeoning segment of the auto industry stands out, with much higher-than-average negativity in reviews: electric vehicles (EVs).
Many EV brands sell directly to the consumer, without dealers.
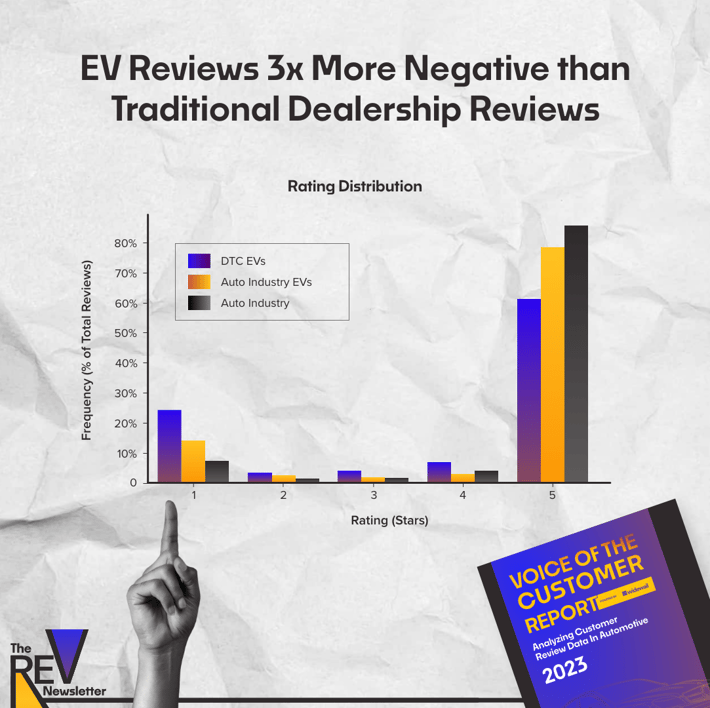
And yet EV Google reviews, particularly direct-to-consumer EV reviews, are strikingly bad. 3 times the industry average for negativity.
What's going on here?
Electric vehicles sold directly to consumers (we looked at Tesla & Rivian) lead in negativity with 32% negative reviews (1, 2 & 3 stars). The industry benchmark is 10%. Even EVs sold at traditional dealerships have 18% negativity.
Let’s take a look at the average ratings by grouping:
Traditional dealers: 4.41 stars
Dealership-Sold EVs: 4.30 stars
Tesla: 3.89 stars
Studying Tesla’s business model, we have five theories to give its low ratings some context.
Positive buyer/ownership moments happen offsite. Tesla purchases happen online and small maintenance issues are resolved via mobile service teams. The remaining issues requiring a service center visit are generally time-consuming and expensive. Tales of these experiences end up surfacing on Google.
Face-to-face interactions are secondary. Sales happen online. The only way to book an appointment is on the Tesla app. To create a digital experience, the company has removed the #1 influence on positive reviews - staff. Staff is the most frequently mentioned topic, showing up in 57% of positive reviews.
For the other 3 explanations, go to pages 51-52 of the Voice of the Customer Report.
EXPLORE
Expectations and Communication
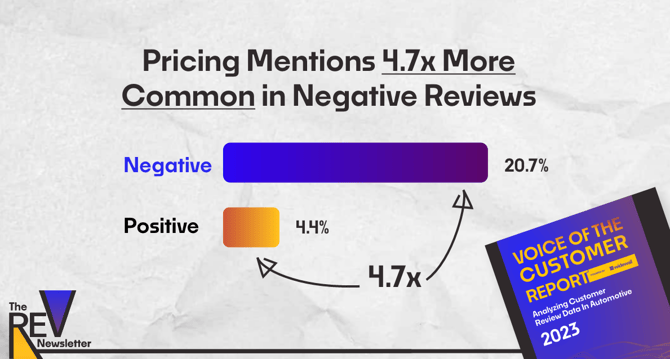
Buyers love a good deal. But mentions of price only show up in 4.4% of positive reviews.
Compare that to 20.7% of negative reviews. That’s 4.7 times more often.
When we look at the data, we generally find that the sales department is more often related to positive reviews and the service department more negative. Using that as a starting point, we can better assess what these numbers mean.
The average cost of a new vehicle is near a record high - $48,451 - up 61% since 2012. Despite this, we believe the wealth of transparent sales pricing information online has helped today’s car shopper show up to the lot ready to pay that $48k. They’ve made peace with it, meaning it's unlikely to appear in a review.
Data indicates that most of the negativity in reviews stems from misaligned expectations and communication - particularly in service.
Service pricing is unique to each scenario and, therefore, not always understood beforehand. Without proper communication and management of expectations, service customers are much more likely to be frustrated with the outcome.
We cover a whole chapter on how consumers think about price, starting on page 27.
VISUALIZATION
Predicting Positive Outcomes
We know which categories can predict positive reviews. And we know exactly by how much.
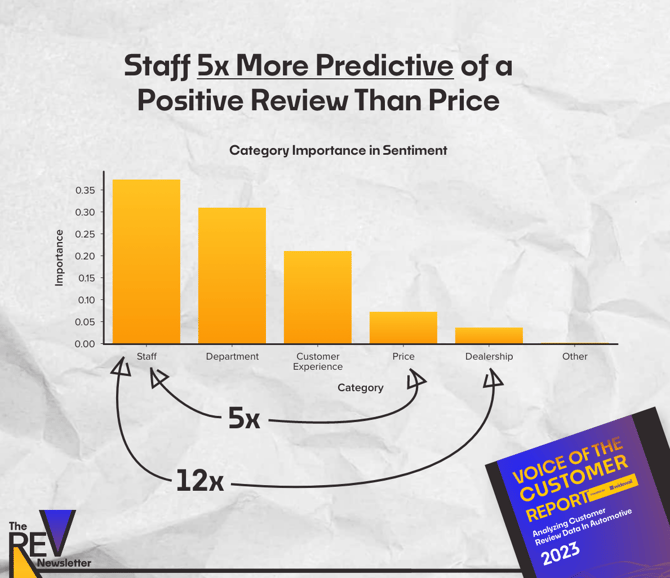
Using the data science concept of “mean decrease impurity,” labeled above as “importance,” we can determine how likely it is that mentioning a certain topic will determine the sentiment of a review.
We found that staff is 5 times more predictive of a positive outcome than pricing (cost, warranty, deals) and 12 times more predictive than dealership topics like inventory, loaner cars or valet services.
We also researched if deals impact reviews. Go to page 30 to read more.
Happy holidays.
You know what makes great holiday reading? Widewail data reports.
More REV in 3 weeks - Jake, Marketing @Widewail