<img alt="" src="https://secure.wire0poor.com/215720.png" style="display:none;">

Access Reputation Index & More

The most comprehensive reputation data resources in automotive, brought to you by Widewail.
  • Widewail Automotive Reputation Index
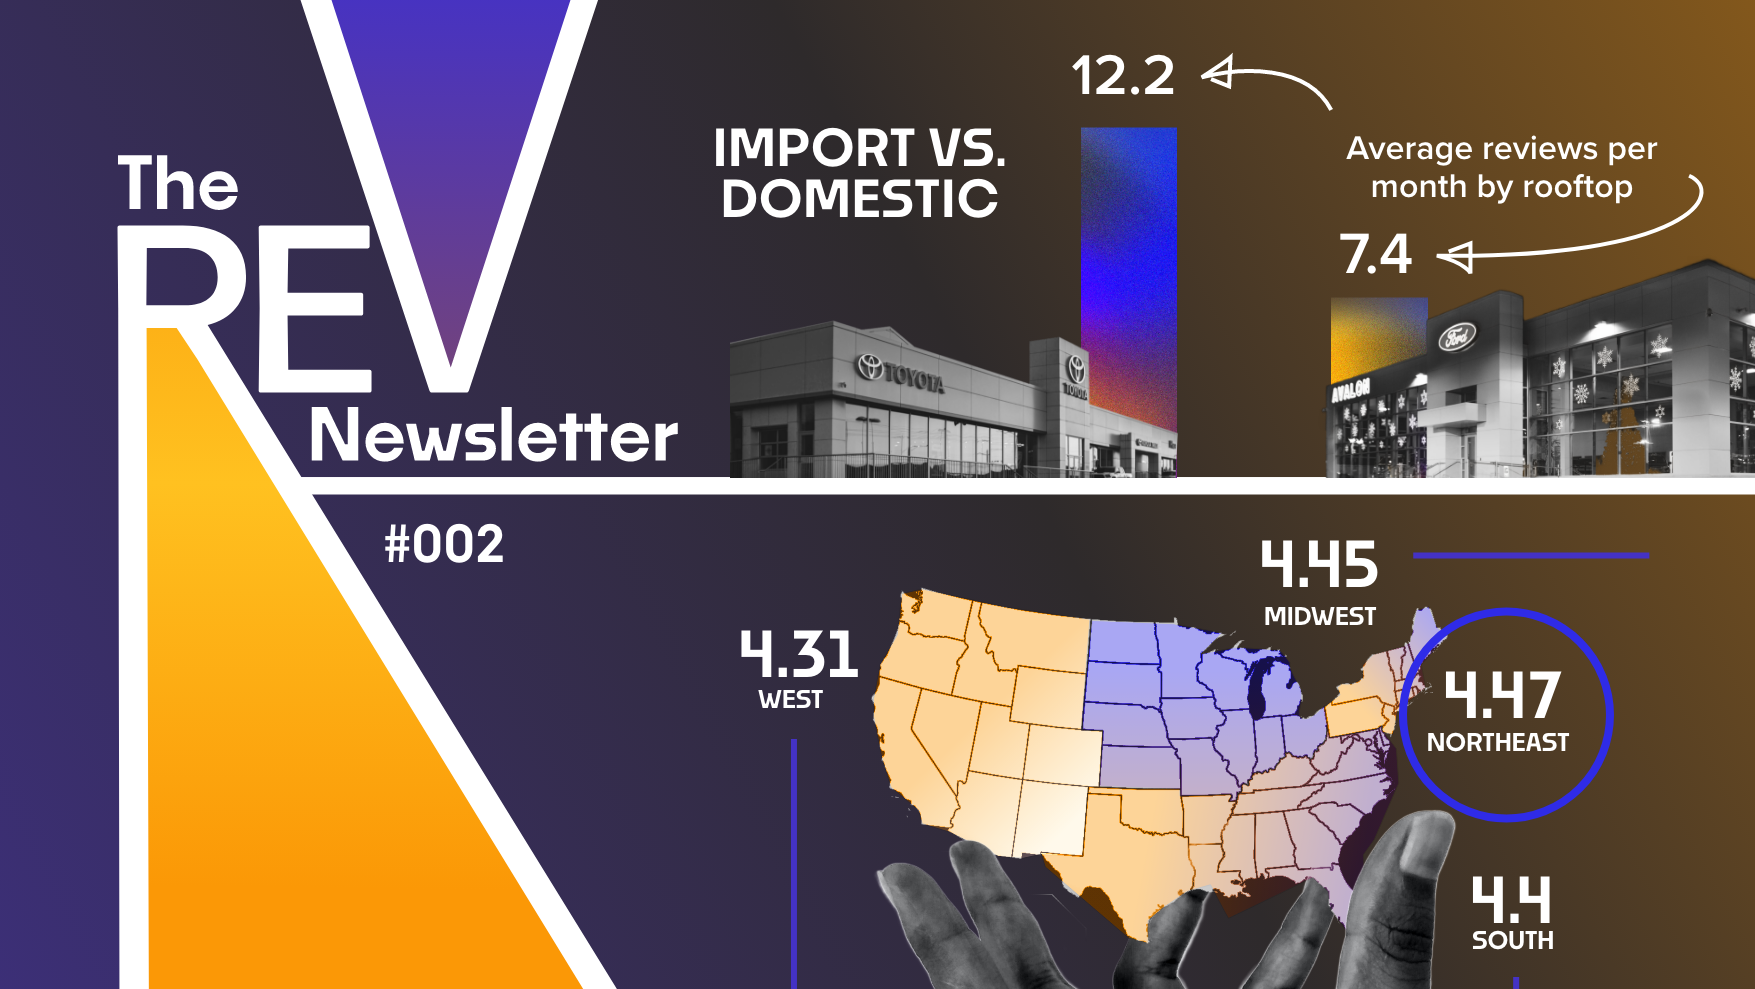
  • The REV Newsletter (1x/month)
  • Industry Reports

1 of 6

Automotive Index Training: Basic Actions

Sort

  • In the top toolbar, click “Sort”

  • Select a column title in the dropdown menu and sort in ascending or descending order

  • Add multiple sorts for additional layers of ordering

2 of 6

Automotive Index Training: Basic Actions

Filter

  • In the top toolbar, click “Filter”

  • Focus on certain areas by filtering by categorical fields like "Brand" or "City"

  • Set conditional filters like "all dealers with an average rating greater than 4"

3 of 6

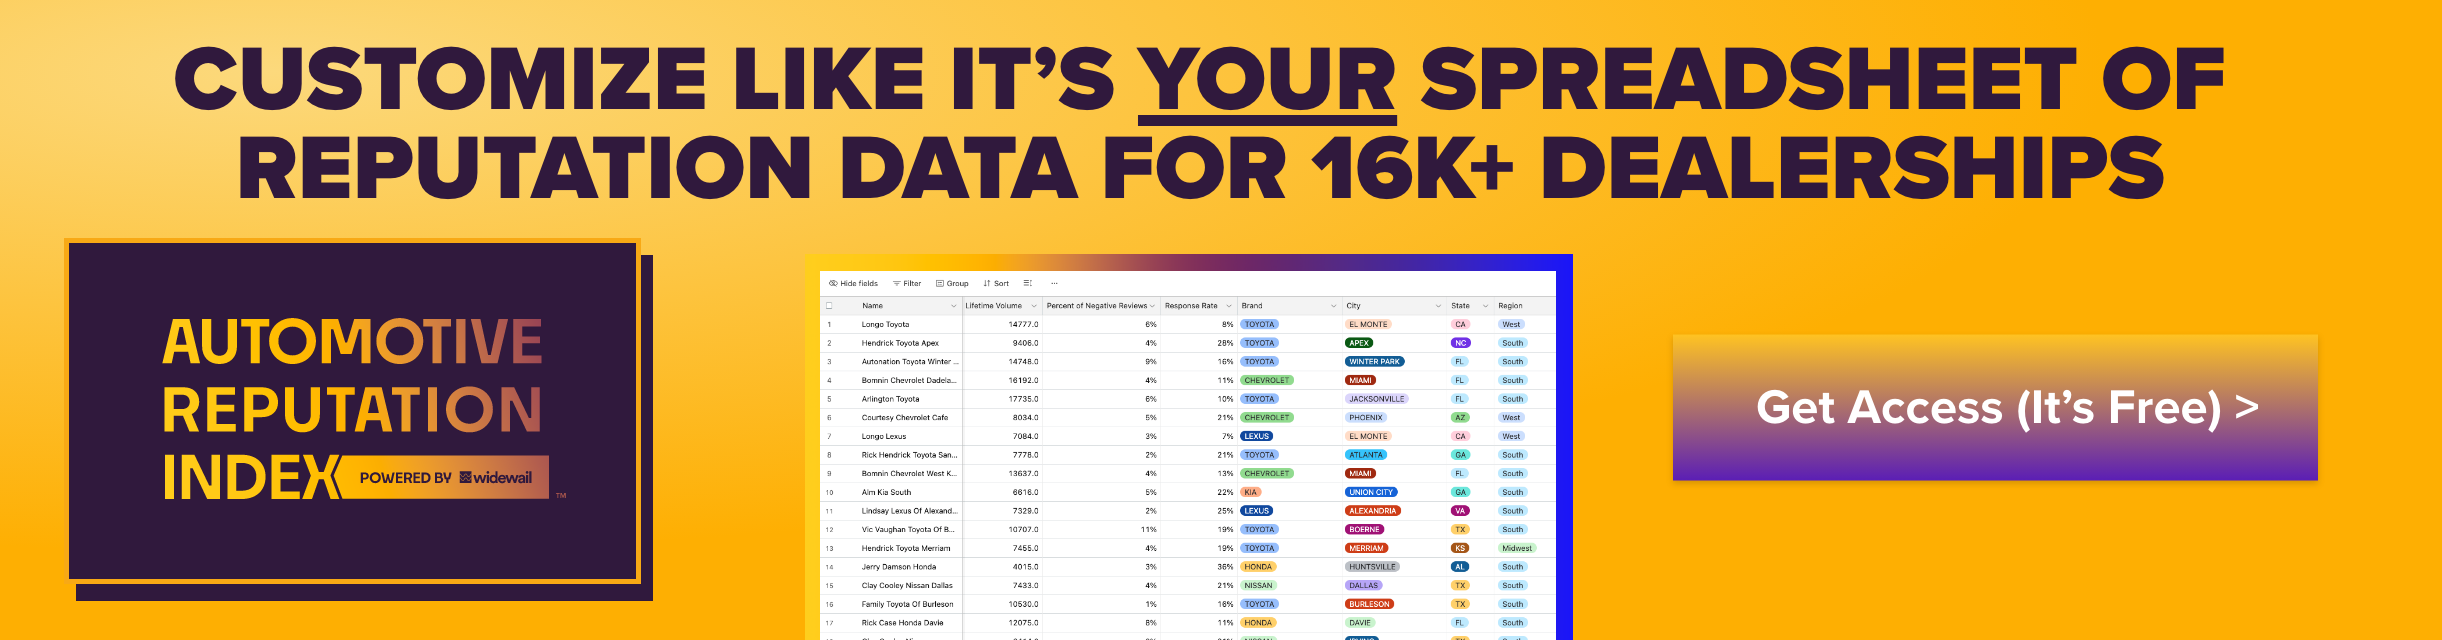
Get to Know the Reputation Data

This Widewail Automotive Reputation Index dataset consists of:

  • 16,671 new car dealers in the U.S.

  • 1.6M reviews

  • Google reviews only

  • Current Timeframe: February through June of 2023

4 of 6

What Does This All Mean?

Find definitions of each column header

In the row of column headers, you can hover over the ⓘ symbol next to each label to read the definition of what is being measured in that column and how the data was collected. 

5 of 6

Where to Find Benchmarks

At the bottom of the table, you'll find aggregated numbers for each column. These are the benchmarks. We've preset the benchmarks in each column for you.

The benchmark data updates as you filter and sort the table, producing thousands of variations, each specific to your market or interests.


6 of 6

Common Use Cases & More

Below the Reputation Index table, you'll find a Common Use Cases section to get you started. Each common use case includes a how-to video.

The Automotive Reputation Index is ever-evolving. Check back regularly for updated data and new use cases. If your dealership is missing and you’d like to add it to the Index, select “Submit a request to add.”

Get Started
November 29, 2023

REV #002: Regional Rating Benchmarks, Import vs. Domestic OEMs, Response Rate Impact

REV #002: Regional Rating Benchmarks, Import vs. Domestic OEMs, Response Rate Impact

Welcome the REV. A briefing that goes deep into the Widewail Automotive Reputation Index data, surfacing the most interesting insights. Every 3 weeks we Rank, Explore & Visualize automotive reputation & sentiment data. 

All data is sourced from the Widewail Automotive Reputation Index (unless noted). The Index aggregates over 1.6 million Google reviews from 16k new car dealerships in the U.S. Customize the dataset like it's your own personal spreadsheet. Try it out. It’s free.


RANK

Wicked Popular

The country's perimeter splits the rankings; the Northeast is the highest-rated region, and the West is the lowest. 

The South is creating the highest review volume, with a median monthly review volume of 11.5, above the national benchmark of 9.6.

The Midwest and the Northeast tie with a negative reviews percentage of 13%, slightly lower than the national average of 14%.

The West leads in review response percentage at 71%, while the national average is 69%.

Do your own research

Group by “Region.” Go to Index.


EXPLORE

Imported Greatness

Why? Well, the sentiment data is inconclusive.

To determine why imported brands are dramatically outperforming domestic brands, we conducted a sentiment analysis of 719,000 Google reviews. 

However, after looking at 27 of the most common review topics, for example, personnel, communication and loaner cars, we found that the composition of positive and negative sentiment between the two groups is almost identical, not varying by more than one percentage point for any topic. From a customer experience standpoint, our analysis does not identify any apparent flaws in the domestic brands that bring volume down.

The Import list stacks high-volume heavy hitters

Lexus: 20.9 reviews/month

Toyota: 18.3

BMW: 16.2

Nissan: 15.8

Kia: 15.7

Honda: 15.0

National Average: 9.6

High-sales-volume economy brands make sense at the top of the list, but luxury brands BMW and Lexus break the trend. It seems it isn’t as simple as more sales = more reviews.

Domestic brands average a 4.4 rating, while Imports average 4.42.

Do your own research

Filter by the “Domestic” or “Import” tag. Go to Index.


VISUALIZE

Response-able

Comparing a 20% response rate -> 80% response rates

Review Volume +64%

Based on the trend line, we see a volume jump from 9 to 14 reviews/month - or +64% when comparing dealers with a 20% response rate to an 80% response rate.

Ratings +2%

Again referencing the trend line, ratings jump from 4.5 to 4.585 - or 2% when comparing dealers with a 20% response rate to an 80% response rate.

Do your own research

Group by “Response Rate.” Go to Index.


If you liked this research, please subscribe. And share with friends. As noted above, the data source for all the great research in the REV is the Widewail Automotive Reputation Index. It's free, so please try it out.

More REV in 3 weeks - Jake

In-article CTA 3 – 1